

When you're first dipping your toes into real estate investing, the sheer number of metrics can feel overwhelming. But there's one simple tool that I always tell new investors to master first: the Gross Rent Multiplier, or GRM.
Think of it as a quick-and-dirty way to size up a rental property's price tag. It answers a very basic question: how many years of gross rent would it take to pay for the property? Critically, this is before you factor in a single dollar of expenses like taxes, insurance, or repairs.
Decoding the Gross Rent Multiplier
Here’s an analogy I like to use. Imagine you're at a Fresno farmer's market, and two vendors are selling identical-looking baskets of peaches, but they have different prices. The GRM is like quickly calculating the price per peach to see which basket is the better deal on the surface. It’s not a deep dive, but it's an incredibly useful first look.
The GRM is all about getting a feel for a property's value relative to its raw income potential. You simply divide the property’s price by its annual gross rental income. The result tells you how many years it would take for that rent to cover the purchase price, ignoring all the operating costs for now. If you want to dive deeper into the fundamentals, J.P. Morgan's analysis offers a great institutional perspective on this metric.
To give you a quick reference, here’s a simple breakdown of the core ideas behind GRM.
GRM At a Glance Key Concepts
| Concept | Simple Explanation | What It Tells You |
|---|---|---|
| The Formula | Property Price ÷ Annual Gross Rent | How many years of gross rent it takes to pay for the property. |
| The "Gross" Part | Uses rent before any expenses are deducted. | It’s a measure of raw income potential, not profitability. |
| The Goal | To compare similar properties in the same market. | A lower GRM is generally better, suggesting a better price for the rent. |
| The Limitation | It ignores operating costs, which can vary wildly. | It's a starting point, not the final word on an investment. |
This table should help you keep the main points straight as we move forward. Remember, it's a tool for a first look, not a full analysis.
A Tool for Initial Screening
So, where does the GRM fit into a real investor's workflow? Its biggest job is to help you sift through dozens of listings without getting stuck in the weeds. Instead of building a complex spreadsheet for every single property that catches your eye, the GRM lets you quickly filter the list.
It helps you do a few things right off the bat:
- Rapid Comparison: Easily stack up multiple properties to see how their prices compare to their income.
- Identify Red Flags: A GRM that's way higher than other comparable properties might mean it’s overpriced for the rent it commands.
- Spot Opportunities: A surprisingly low GRM could be a sign of an undervalued gem that’s worth a much closer look.
GRM provides a simple answer to a crucial question for investors: 'How many years would it take for the gross rent to pay back the property's purchase price?' It sets the stage for a deeper financial dive.
Ultimately, getting comfortable with the GRM is the first step toward making smarter, faster investment decisions. It’s the filter you use before you put in the serious work to calculate a rental property's true value, which requires a much more detailed look at expenses and net income.
Calculating the Gross Rent Multiplier Step by Step
Ready to run the numbers yourself? The good news is that figuring out the Gross Rent Multiplier is refreshingly simple. You don't need any complex financial software, just a basic calculator. It's a fundamental skill every investor should have for quickly sizing up a property's income potential against its price.
The formula itself is as straightforward as it gets. You just need two key numbers for any property you're looking at.
Gross Rent Multiplier = Property Price / Gross Annual Rent
This quick calculation gives you a single number that tells you how many years it would take for the gross rental income to completely pay off the property's purchase price. Let's walk through how to find each of these numbers so you can do it with confidence.
Finding the Property Price
First up, you need the Property Price. Now, this isn't just the sticker price you see on Zillow. For a truly accurate calculation, you need to think about the total cost to get that property into your hands and ready for a tenant.
This means you should add up:
- The final purchase price you negotiate.
- Any closing costs you'll have to pay.
- The estimated cost of any immediate repairs needed to make it rent-ready.
For instance, say a Fresno property is listed for $350,000. You figure you'll have about $10,000 in closing costs and need to sink $5,000 into new paint and carpet right away. Your real "Property Price" for this formula would be $365,000. Using this all-in number gives you a much more realistic GRM.
Determining Gross Annual Rent
Next, you'll need the Gross Annual Rent. This is simply the total rent you expect to collect over a full year, before taking out a single penny for expenses.
To get this, just take the monthly rent and multiply it by 12. If a duplex over in Clovis rents for $1,600 a month, its Gross Annual Rent is $1,600 x 12 = $19,200. It's crucial to use the gross number here. Don't worry about things like vacancies, property management fees, or maintenance just yet—those come into play with more detailed analysis later on.
This infographic breaks down the process visually, showing how these two inputs come together.
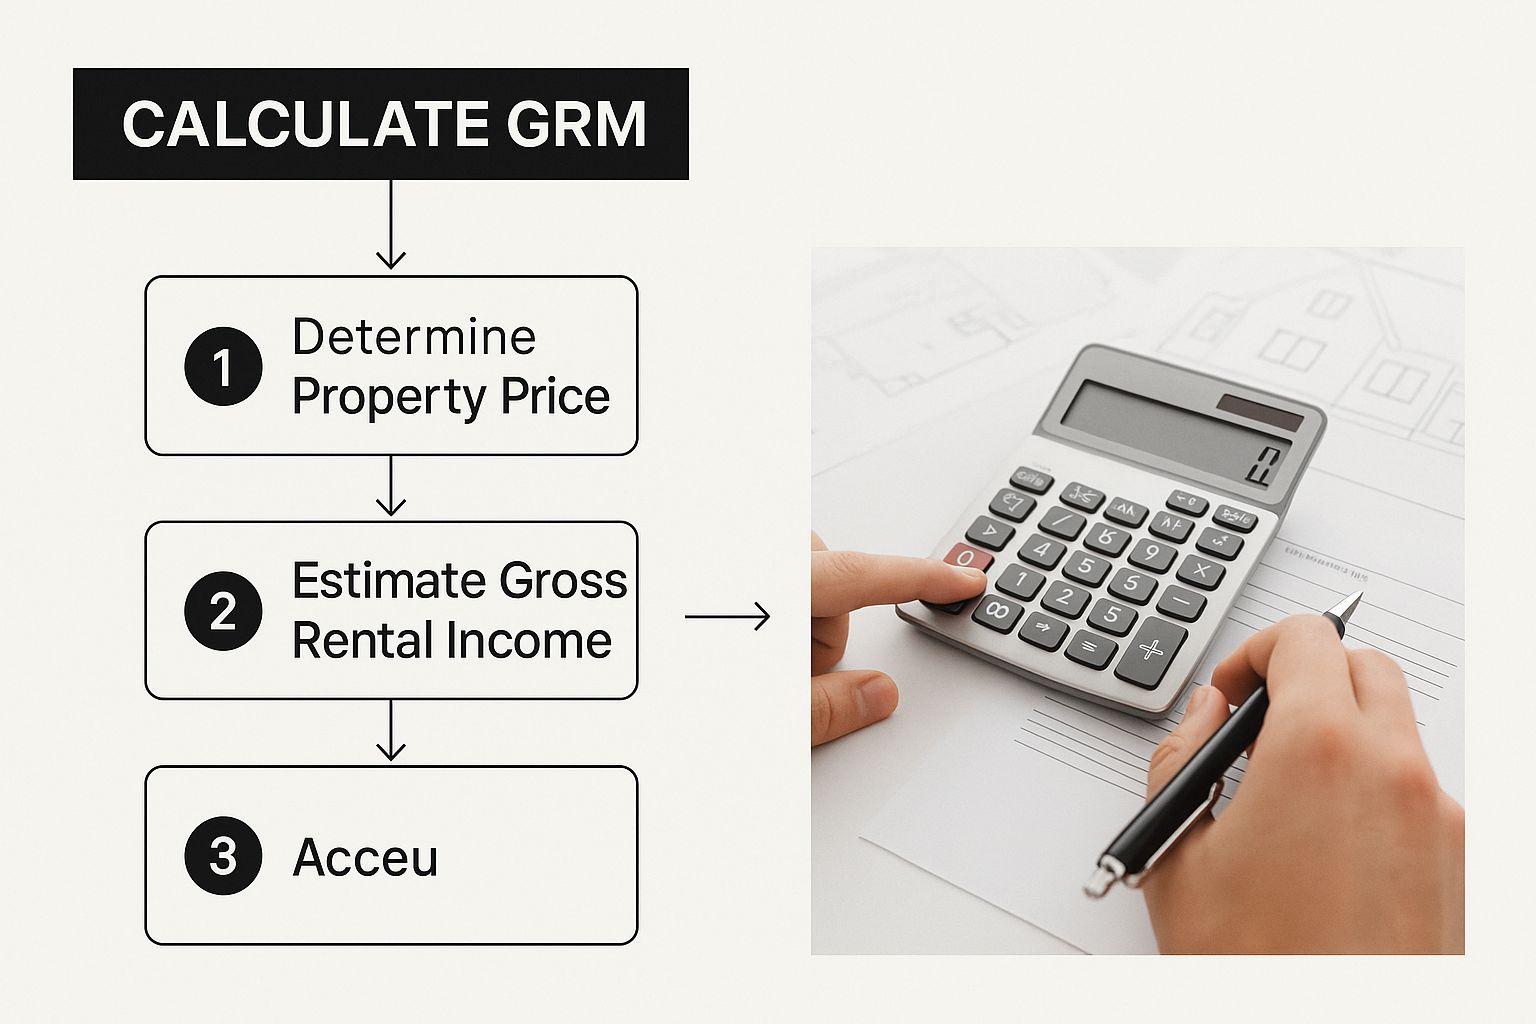
As you can see, the GRM calculation is all about the direct relationship between what you pay for the property and the raw income it produces.
Putting it all together with our example numbers: a $365,000 property that brings in $19,200 in gross annual rent gives you a GRM of 19.0 ($365,000 / $19,200). While this back-of-the-napkin math is a fantastic starting point, using a dedicated rental property value estimator can help you play with different scenarios and layer in more market data for a sharper analysis.
What’s a Good Gross Rent Multiplier, Anyway?
You’ve done the math and calculated your Gross Rent Multiplier. Now you’re staring at a single number. So what? What does that number actually tell you about the property? This is where a savvy investor separates themselves from a novice—learning to interpret this figure is key.
Think of the GRM less like a final grade and more like a compass. It’s a quick directional tool, pointing you either toward or away from a potential deal.
The core idea is refreshingly simple: a lower GRM is generally better. A smaller number suggests the property's price is low relative to the rent it brings in. In other words, you’re looking at a potentially faster payback period on your investment, based on gross rent alone.
Finding the Sweet Spot
So, what’s the magic number? While it’s always going to shift from one market to the next, there are some general rules of thumb that can give you a solid baseline.
Most investors I know get interested when they see a GRM between 4 and 7. This range often signals a healthy balance between what you’re paying for the property and what it can earn. Once the GRM starts climbing much higher than that, it can be a red flag.
A high GRM could mean a property is just plain overvalued for the rent it can command. On the flip side, an unusually low GRM might be a screaming deal—or it could be hiding some serious problems that need a much, much closer look.
This is exactly why you never, ever rely on the GRM by itself. A fantastic number still demands serious due diligence.
Why Context Is King
A "good" GRM in Fresno isn't the same as a "good" GRM in San Francisco. It's completely dependent on the local market. For instance, a GRM of 8 might be considered a fantastic deal in a high-growth, high-appreciation area where property values are skyrocketing. But in a slower, more stable market, that same GRM of 8 could look seriously overpriced.
Several factors will always influence what’s considered a good GRM for any given property:
- Property Location: Is it in a hot neighborhood? High-demand areas naturally have higher property values, which will push the GRM up.
- Property Type: A duplex or fourplex will almost always have a lower (and better) GRM than a single-family home because you have multiple streams of rental income.
- Property Condition: A turnkey, freshly renovated property can command higher rent, giving it a much more attractive GRM than a fixer-upper that needs a ton of work.
Most real estate pros I talk to consider a GRM below 7 to be pretty favorable, since it points to a faster payback from gross rent. When you see a GRM creep above 10, it’s time to be cautious unless other factors—like massive appreciation potential—justify that higher price.
Ultimately, figuring out if a GRM is "good" comes down to one thing: comparing it to similar properties in the same neighborhood. You have to see how it stacks up against the local competition.
How GRM Works with Real World Examples
Formulas are one thing, but the true power of the Gross Rent Multiplier really clicks when you start applying it to actual properties. Watching the numbers play out is the best way to see how this simple metric helps investors cut through the noise and quickly size up different opportunities.
Let’s put ourselves in the shoes of an investor looking at two different properties right here in the Fresno area. The goal is to use GRM as a quick first filter to see which one deserves a deeper dive.
Scenario 1: The Downtown Condo
First up, you’ve found a slick one-bedroom condo in the Tower District. It's in a hot area that pulls in young professionals who love being close to cafes and nightlife.
- Purchase Price: $250,000
- Monthly Rent: $1,800
To get the GRM, we first need to figure out the gross annual rent. That’s just the monthly rent multiplied by 12.
So, the Gross Annual Rent is $1,800 x 12 = $21,600.
Now we can pop those numbers into the formula:
GRM = $250,000 / $21,600 = 11.57
A GRM of 11.57 means it would take just over 11 and a half years of gross rent to cover the purchase price. That might seem a little high, but properties in prime spots often command higher GRMs because of their strong appreciation potential.
Scenario 2: The Suburban Duplex
Next on your list is a duplex in a quiet Clovis neighborhood known for its great schools. It’s an older property, but it comes with two reliable, long-term tenants already in place.
- Purchase Price: $400,000
- Monthly Rent (Total for both units): $3,200
Let's do the same calculation and find the gross annual rent for the duplex.
The Gross Annual Rent is $3,200 x 12 = $38,400.
Now for its GRM:
GRM = $400,000 / $38,400 = 10.42
The duplex clocks in with a GRM of 10.42. On paper, that's a more attractive number than the condo's 11.57.
By using GRM, you can see in an instant that the duplex has a better price-to-rent ratio. This doesn't automatically crown it the winner, but it's a strong signal that it probably warrants your time for a full analysis of its expenses and cash flow.
Of course, getting those numbers to work in the real world depends on solid management. Keeping the property maintained and the rent flowing in is critical. This is where top-notch property management apps can be a huge help, ensuring your gross rents stay consistent and your GRM stays strong.
Let's look at this comparison side-by-side to make the initial screening process even clearer.
Rental Property GRM Comparison
| Property Type | Purchase Price | Gross Annual Rent | Calculated GRM | Initial Assessment |
|---|---|---|---|---|
| Downtown Condo | $250,000 | $21,600 | 11.57 | Higher GRM, common for high-demand areas. May have better appreciation. |
| Suburban Duplex | $400,000 | $38,400 | 10.42 | Lower GRM, suggesting a better price-to-rent ratio. Warrants a closer look. |
This quick side-by-side is exactly what GRM is made for. It’s a back-of-the-napkin calculation that helps you move past the marketing fluff and points you toward the deals that actually make financial sense from a bird's-eye view.
The Good, The Bad, and The GRM
Look, no single number is a magic bullet in real estate investing. If you want to make smart moves, you have to know the tools you're using—strengths, weaknesses, and all. The Gross Rent Multiplier is a fantastic starting point, but it's absolutely critical to understand what it tells you and, more importantly, what it leaves out.
I like to think of the GRM as a flashlight in a dark, unfamiliar warehouse. It's perfect for a quick sweep to see the general layout and avoid tripping over a pile of pallets right in front of you. But it only shows you a tiny piece of the bigger picture, leaving most of the important details in the shadows.
The Upside of Using GRM
The biggest win for GRM is its sheer simplicity. When you're scrolling through dozens of listings, you need a fast way to filter out the noise without building a complex spreadsheet for every property that pops up.
Here’s where it really shines:
- It’s Fast. You only need two numbers: the price and the gross annual rent. With that, you get an instant feel for a property's valuation. It’s the perfect tool for that first pass when you’re comparing a sea of options.
- Easy Comparisons. GRM gives you a clean, apples-to-apples way to see how similar properties in the same neighborhood stack up against each other based on their price-to-rent ratio. This helps you immediately flag properties that seem way overpriced or, just maybe, are a hidden gem.
- No Digging Required. You don't need a seller's private financial records or detailed expense reports to run the numbers. The price and rent are usually right in the listing, making it a tool anyone can use from day one.
The Downside of Using GRM
This is where that flashlight analogy gets real. The GRM’s simplicity is also its biggest blind spot because it intentionally ignores the very things that determine whether a property actually makes you money.
The most important thing to burn into your brain is this: the Gross Rent Multiplier tells you absolutely nothing about cash flow. It ignores every single operating expense, so it can't tell the difference between a cash cow and a property that will bleed you dry every month.
These are its major blind spots:
- Operating Expenses: GRM pretends things like property taxes, insurance, HOA dues, management fees, and maintenance don't exist. You could have two properties with identical GRMs, but one has double the expenses, leading to completely different financial outcomes.
- Vacancy: It operates on the fantasy that the property is rented 100% of the time. It doesn't factor in the real-world cost of a tenant moving out and the unit sitting empty for a month or two, which hammers your actual income.
- Property Condition: A super low GRM might look like a steal, but it could be attached to a fixer-upper that needs $50,000 in urgent repairs. The GRM won't wave a red flag about the busted roof or ancient HVAC system.
When to Look Beyond GRM to Other Metrics
The Gross Rent Multiplier is an exceptional tool for your initial flyover of the investment landscape. It’s perfect for quickly sifting through a long list of potential properties to create a manageable shortlist of real contenders.
But once you’ve zeroed in on those promising candidates, it’s time to swap the wide-angle lens for a microscope. Relying only on GRM for a final decision is like buying a car based purely on its slick paint job—it tells you absolutely nothing about what’s under the hood.
The metric’s real power is its simplicity, but that’s also its biggest pitfall. It gives you a snapshot of value based on gross income, completely ignoring the operational costs that actually determine if a property will make you money or just drain your bank account. This is exactly why you have to look beyond GRM to see the complete financial picture.
Moving from Screening to Analysis
Think of your investment analysis as a two-phase process. GRM is the undisputed star of phase one, helping you compare similar properties in the same market to see which ones have a better price-to-rent ratio.
For phase two, however—the deep-dive financial due diligence—you need more powerful tools that actually account for expenses.
This is where metrics like the Capitalization (Cap) Rate and Cash-on-Cash Return step into the spotlight. These are the numbers that tell the real story about a property’s financial health.
While GRM helps you find potential opportunities quickly, metrics like Cap Rate and Cash-on-Cash Return are what you use to confirm if an opportunity is genuinely profitable.
The Cap Rate, for instance, is calculated using a property's Net Operating Income (NOI), which factors in critical expenses like taxes, insurance, and maintenance. This gives you a much clearer, more realistic picture of its profitability. You can get a full breakdown by checking out our guide on what Cap Rate is in real estate.
Building a Complete Financial Picture
Savvy investors use GRM alongside other metrics to balance the speed of payback with true net profitability. For properties with multiple income streams—like on-site laundry or paid parking—a related metric called the Gross Income Multiplier (GIM) can be used, as it includes this extra revenue.
Ultimately, a solid analysis always involves a multi-metric approach:
- Use GRM to quickly screen and compare a bunch of listings.
- Calculate Cap Rate to evaluate profitability after all the bills are paid.
- Determine Cash-on-Cash Return to understand the return on your actual invested cash.
For a deeper dive into optimizing rental property performance and uncovering other crucial metrics, consider exploring resources on Short Term Rental Analytics. By using these tools together, you move from a surface-level glance to a confident, well-rounded investment decision.
Common Questions About Gross Rent Multiplier
As you start using the Gross Rent Multiplier in your analysis, you’ll naturally run into a few questions. I see it all the time with new investors. Getting these fundamentals right from the start is key to using the metric properly and not making costly mistakes.
Let's clear up some of the most common points of confusion.
What Is the Main Difference Between GRM and Cap Rate?
This is easily the most important question, and the distinction is critical. Think of GRM as a quick, back-of-the-napkin calculation. It's a blunt instrument that only looks at the property's price versus its raw, potential rental income. It completely ignores every single expense.
The question GRM answers is: "If I paid cash and had zero expenses, how many years of rent would it take to get my money back?"
The Capitalization (Cap) Rate, on the other hand, is a much sharper tool. It measures profitability by using Net Operating Income (NOI), which is what’s left after you subtract all the operating expenses from the gross income.
The Cap Rate answers the real question every investor cares about: "What's my annual return on this thing after all the bills are paid?"
While GRM gives you a fast way to screen a pile of properties, Cap Rate gives you a far more realistic picture of a property's actual financial performance.
Can You Use GRM for Commercial Properties?
Technically, you could, but you really shouldn't. GRM is built for simple residential properties—think single-family homes, duplexes, or maybe a fourplex.
Commercial properties are a different beast altogether. Their income streams are often way more complex than just rent. You might have leases where tenants pay a percentage of their sales, or complex utility sharing arrangements. A simple GRM just can't account for that.
For any serious commercial real estate deal, you’ll want to use a Gross Income Multiplier (GIM) or, more likely, a Cap Rate. Those metrics are designed for the financial complexity you find in commercial investments.
How Do Market Conditions Affect GRM Values?
This is a huge factor. A "good" GRM isn't a fixed number; it's a moving target that shifts with the local market's health. You have to know what's happening on the ground to interpret it correctly.
In a Seller's Market: When homes are flying off the market, prices tend to shoot up faster than rents can keep pace. This makes the GRM values go higher. Buyers are just willing to pay more for the same amount of rental income.
In a Buyer's Market: When there's more inventory than buyers, prices soften while rents might hold steady. This pushes GRM values lower, which can signal that there are better deals to be had.
Knowing whether you’re in a hot or cool market is absolutely essential for making sense of a property's GRM.
Trying to navigate these numbers and a shifting market can feel overwhelming, but you don’t have to go it alone. At Edinhart Realty and Property Management, we live and breathe the Fresno market. We provide the expert guidance investors need to make smart, informed decisions.
Find out how we can help you maximize your returns by visiting us at https://edinhart.com.


