

Analyzing a potential investment property is all about running the numbers to see if it’ll actually make money. It’s the critical step where you dig into the income, expenses, and market value to figure out if a property is a winner or a dud. This process, calculating key metrics like NOI and cap rate, is what separates smart investors from those who end up leaving money on the table.
Building Your Foundation for Smart Property Analysis
Before you even think about plugging numbers into a spreadsheet, you need to lay a solid groundwork. Think of it like this: you can’t build a house on a shaky foundation, and you can’t build a profitable portfolio on bad data. The quality of your analysis depends entirely on the quality of your inputs.
A detailed real estate investment property analysis is your best defense against a bad deal, especially in a market as unique as Central California. Relying on Zillow estimates or national averages just won't cut it here. The numbers you use for rent, taxes, and maintenance have to reflect the reality on the ground in Fresno, Clovis, or wherever you're looking to buy.
The Core Components of Your Analysis
To get an accurate financial picture, you have to nail these three fundamental concepts:
- Gross Scheduled Income (GSI): This is your best-case scenario. It’s the total potential rent you could collect in a year if the property was 100% occupied and every single tenant paid on time, every time.
- Vacancy Loss: Let's be realistic—no property stays full 100% of the time. This number, typically a percentage of your GSI (we often use 5-10% as a starting point), accounts for the income you'll lose when a unit is sitting empty between tenants.
- Operating Expenses (OpEx): These are all the costs to keep the lights on and the property running smoothly, not including your mortgage payment. We're talking about property taxes, insurance, routine maintenance, property management fees, and sometimes utilities.
Getting these elements right is non-negotiable. They are the building blocks for every other calculation you’ll make. A great first step is conducting a thorough feasibility study to really vet the project's potential and identify risks before you're too deep in.
A flawed analysis built on bad data is worse than no analysis at all. It gives you a false sense of security that can lead straight to a major financial headache.
This kind of detailed groundwork is more important than ever. Global property markets are shifting, with some reports suggesting 2025 could be a turning point with more stable prices, creating great entry points for savvy investors. For context, some European sectors saw total returns hit over 10% in 2024, thanks to strong performance in industrial and residential assets. This global view just hammers home why a precise, localized analysis is the only way to capitalize on opportunities right here in our own backyard.
Crunching the Numbers: Your Core Profitability Metrics
Once you’ve gathered all your raw numbers—income, vacancy rates, and anticipated expenses—it’s time to turn that data into real, actionable intelligence. This is the absolute heart of analyzing any investment property. It's where you find out if a deal actually works.
We're going to walk through the four key metrics that truly reveal a property's financial story. These aren't just formulas to memorize; they're the tools you’ll use every day to compare different opportunities, get a lender to say "yes," and confidently tell a great investment from a money pit. Let's dig in with a practical example right here in Fresno.
Net Operating Income: The Property’s True Earning Power
Before you can figure out any kind of return, you have to nail down the Net Operating Income (NOI). Just think of NOI as the property's annual profit before you factor in your mortgage or income taxes. It’s the single most critical number for judging a property’s performance on its own merits.
The formula is pretty simple:
Gross Operating Income (GSI – Vacancy) – Total Operating Expenses = Net Operating Income (NOI)
This flowchart breaks down how you get from your total potential rent to the actual cash the property generates.

As you can see, you have to subtract realistic losses (like vacancy) and every single operating cost to land on an accurate profit figure. Don’t ever skip this step.
Let's run the numbers on a single-family home in Fresno's 93720 zip code:
- Gross Scheduled Income (GSI): Rent is $2,500/month, which comes out to $30,000 a year.
- Vacancy Loss (5%): $30,000 x 0.05 = $1,500.
- Gross Operating Income (GOI): $30,000 – $1,500 = $28,500.
- Total Operating Expenses (OpEx): Add up property taxes ($3,000), insurance ($1,200), maintenance ($1,500), and property management ($2,850) for a total of $8,550.
Now, let's find the NOI: $28,500 (GOI) – $8,550 (OpEx) = $19,950 (NOI).
That $19,950 is the pure, unadulterated cash the property itself generates annually. If you want to get a better handle on this foundational metric, you can learn more about what Net Operating Income is and why it matters.
Capitalization Rate: The Quick Comparison Tool
Next up is the Capitalization Rate (Cap Rate). This is a simple but incredibly powerful metric for quickly comparing the potential return of different properties, no matter their price. It just shows the relationship between a property's NOI and what it's worth on the market.
The formula is: NOI / Current Market Value = Cap Rate
Using our Fresno property, let's say the purchase price is $380,000.
$19,950 (NOI) / $380,000 (Market Value) = 0.0525 or a 5.25% Cap Rate
A 5.25% Cap Rate acts as a standardized benchmark. Is that good? It really depends on the local market. Here in Fresno, investors are often looking for cap rates somewhere between 5% and 8%. Now you can easily compare this 5.25% deal to another one down the street with a 6% cap rate and see which offers a better return for the price.
Cash-on-Cash Return: What’s Actually Hitting Your Bank Account
While Cap Rate is awesome for quick comparisons, the Cash-on-Cash Return tells you what you really want to know: what’s the return on the actual money you pulled out of your pocket? This metric brings your financing into the picture, which the Cap Rate completely ignores.
The formula looks like this: Annual Pre-Tax Cash Flow / Total Cash Invested = Cash-on-Cash Return
To figure this out for our Fresno house, we need a couple of new numbers:
- Total Cash Invested: Let's assume a 20% down payment on the $380,000 home ($76,000) plus $9,000 in closing costs. Your total out-of-pocket cash is $85,000.
- Annual Debt Service: This is just your total mortgage payments for the year. A $304,000 loan at 7% interest will cost you about $24,270 a year.
Now, calculate the Annual Pre-Tax Cash Flow:
$19,950 (NOI) – $24,270 (Debt Service) = -$4,320
Hold on—it's negative? Yes, and this is a huge discovery. Your analysis just uncovered that this property is negatively geared, meaning its own income doesn't cover the mortgage payment. This is a major red flag that simpler metrics would have missed.
A positive Cash-on-Cash Return means the property puts money in your pocket each year after every bill and the mortgage is paid. A negative return means you're feeding it cash just to keep it going.
Return on Investment (ROI): The Big Picture
Finally, the Return on Investment (ROI) gives you the long-term view. It measures your total return by looking at not just cash flow but also the equity you're building and potential appreciation. It’s a more complete picture of how your invested capital is performing over time.
A simplified formula for ROI is: (Annual Return + Equity) / Total Cash Invested = ROI
Let's switch to a better, cash-flowing property that generates $2,400 in positive cash flow annually, where you also paid down $3,000 of the loan principal in the first year.
- Annual Return: $2,400 (Cash Flow)
- Equity Gained: $3,000 (Principal Paydown)
- Total Gain: $2,400 + $3,000 = $5,400
If your total cash invested was the same $85,000, the ROI would be:
$5,400 / $85,000 = 0.0635, or a 6.35% ROI
This 6.35% ROI shows how your initial investment is growing through both rental profits and building actual ownership. By calculating all four of these metrics, you elevate your analysis from simple guesswork to a sophisticated strategy that points you toward profitable decisions.
Key Profitability Metrics At A Glance
To keep things straight, here’s a quick summary of the core metrics we just covered. Think of this as your cheat sheet for property analysis.
| Metric | Formula | What It Measures |
|---|---|---|
| Net Operating Income (NOI) | Gross Operating Income – Operating Expenses | The property's standalone profitability before debt. |
| Capitalization Rate (Cap Rate) | NOI / Market Value | The unleveraged rate of return, perfect for comparing properties. |
| Cash-on-Cash Return | Annual Cash Flow / Total Cash Invested | Your direct return on the actual money you put into the deal. |
| Return on Investment (ROI) | (Annual Return + Equity) / Total Cash Invested | A holistic view of your total return, including equity growth. |
Getting comfortable with these four calculations is non-negotiable for any serious investor. They tell the complete financial story of a property and empower you to make smarter, more confident investment choices.
How to Nail Your Market and Rent Analysis
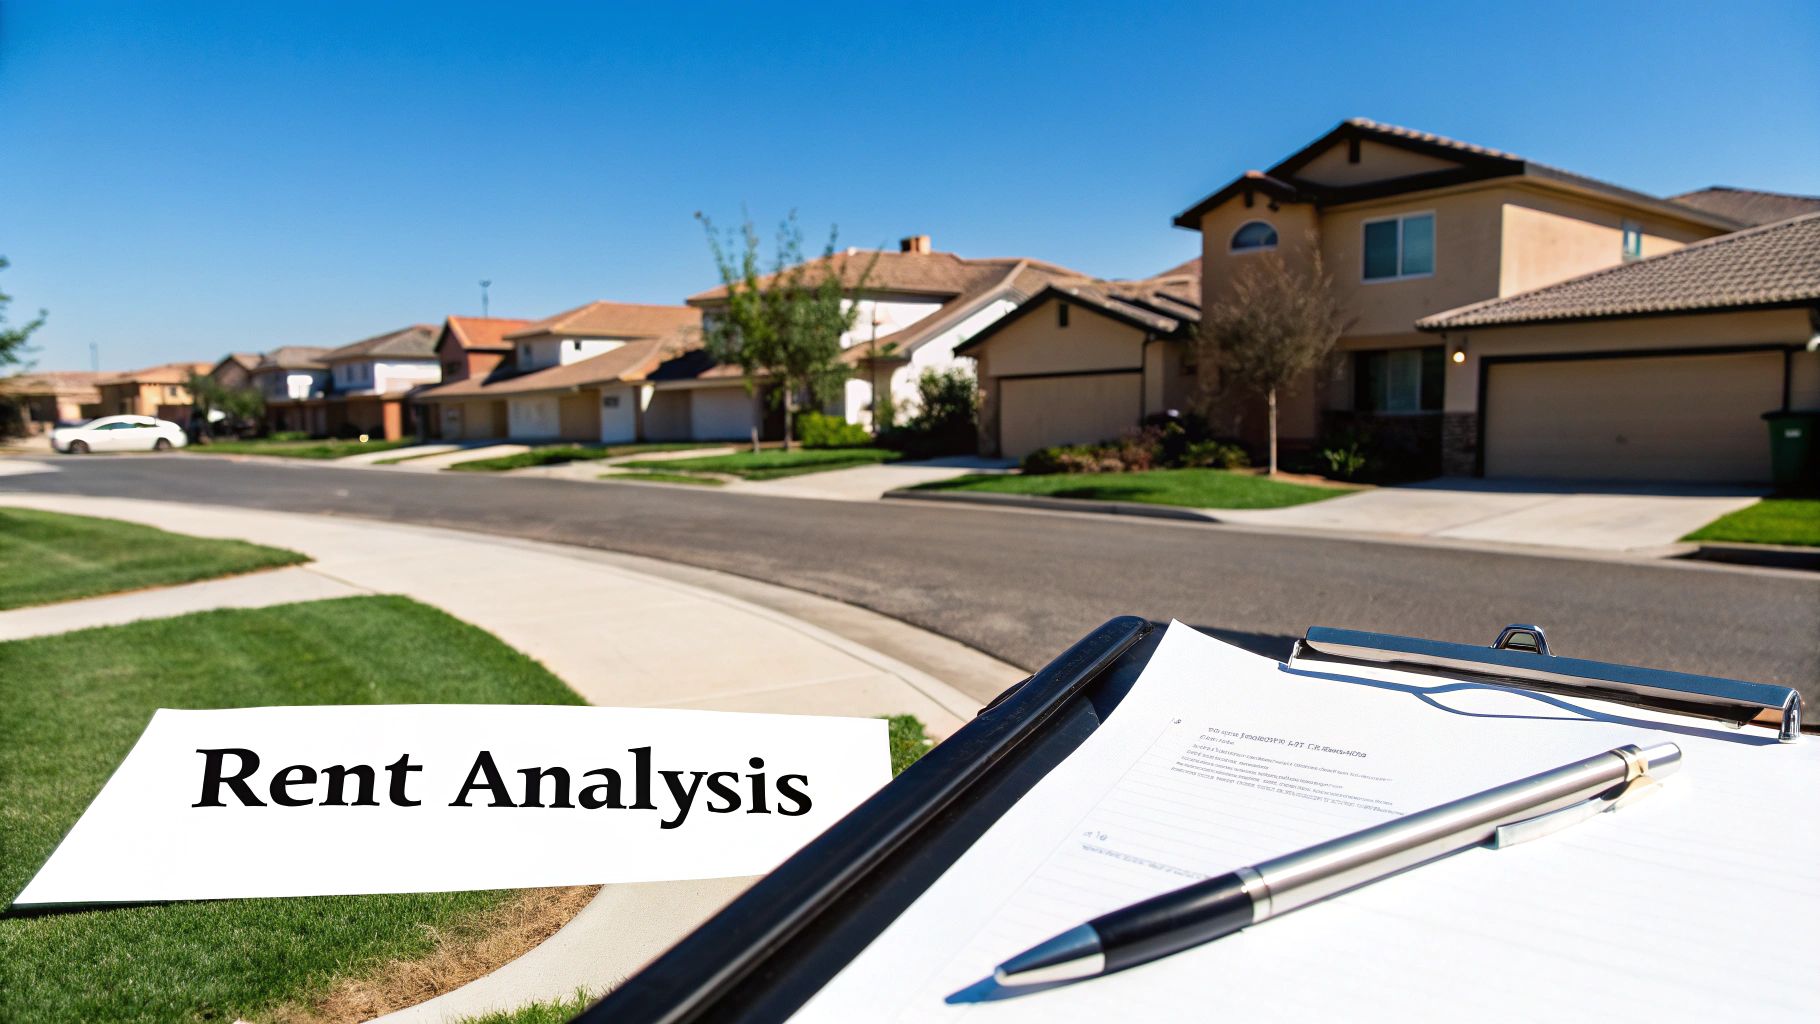
Getting the market data right is the absolute backbone of a solid investment property analysis. You can run all the fancy formulas you want, but if your inputs are off, your results will be, too.
In a market like Fresno, this step is what separates a great deal from a money pit. The goal is to avoid overpaying on the purchase and leaving money on the table with rents set too low.
Finding Solid Comps
Your first move is to pull recent sales data for properties that are genuinely similar in size, age, and, most importantly, location.
For a property in Northeast Fresno, I'd zero in on comps sold within the last six months, specifically within the Clovis Unified School District boundaries. That's where you'll find the most relevant data.
- Stay Close: Stick to homes within a half-mile radius of your target property. A few blocks can make a big difference in value.
- Apples to Apples: Match the bedroom and bathroom count, square footage, and lot size as closely as possible.
- Condition is Key: Look at the pictures. Compare properties with similar levels of renovation and amenities. A fixer-upper isn't a good comp for a turnkey rental.
- Timing Matters: Always prioritize the most recent sales. The market can shift quickly, and a sale from nine months ago might be outdated.
By calculating the average price per square foot from these comps, you start to build a realistic range for what your offer should be.
For example, we recently saw a 1,900 sq ft home on Peach Avenue sell for $480,000, while a slightly smaller 1,850 sq ft house just two blocks over went for $460,000. This gives us a tight price-per-square-foot spread right around $252, which is a great data point for setting your offer ceiling.
Adjusting for Property Condition
Now, you have to look beyond the raw numbers. Does a comparable property have a brand-new kitchen that justifies its higher sale price? Or does your target property need a new roof?
We typically apply 3-5% price adjustments for high-end finishes or significant, necessary repairs.
- Major Renovations: A fully remodeled kitchen or primary bathroom can easily boost a comp's value.
- Minor Updates: Fresh paint and new flooring will move the needle, but not as dramatically.
- Deferred Maintenance: An old roof or an aging HVAC system will pull the value down, often by 2-3%.
Running the Rental Numbers
For your rental market analysis, the process is similar. Pull up active rental listings for homes on the same blocks in, say, northeast Fresno.
You'll want to log the advertised rents for three-bedroom, two-bath units and pay close attention to the amenities mentioned, like updated kitchens or smart home features.
- Condition Pays: Updated flooring and fresh paint consistently command higher rents.
- The Yard Factor: A nice, fenced backyard can add almost 5% to the monthly rental value in family-friendly neighborhoods.
- School Zones: Being in the Clovis district is a huge draw. Those homes often rent for 10% more than comparable homes just outside the boundary.
- Seasonal Swings: Don't forget about seasonality. The rental market heats up in the summer, and we often see rents jump 8-10% during peak moving season.
Just this past year, we tracked similar three-bed homes on Fowler Avenue listing at $2,300 in the spring, only to see them climb to $2,450 by July. After sifting through the data, you’ll land on an accurate rental range—often between $2,200 and $2,500 per month for a standard single-family home in a good area.
Fine-Tuning with a Fair Market Rent Calculator
To really sharpen your estimates, you need to use tools built specifically for the Fresno market. Guesswork just doesn't cut it when things are moving this fast.
For a quick, data-backed figure, check out our Fair Market Rent Calculator. It gives you up-to-date rent figures broken down by neighborhood.
At Edinhart, our platform is constantly updating with live rental comps, which saves our clients hours of manual research and prevents costly miscalculations.
How Do We Stack Up Globally?
It can also be helpful to zoom out and see how local returns compare to what's happening elsewhere. This adds another layer of confidence to your projections.
Globally, some markets are seeing incredible returns. For example, Dubai is projected to deliver average yields of 6-7% on apartments in 2025. In Europe, they're seeing 4% rental growth in 2024, largely driven by housing shortages. You can dig deeper into these trends in M&G's Global Real Estate Outlook 2025.
Key Takeaway: Comparing your local rent yields to global benchmarks is a great way to spot opportunities and confirm you're investing in a strong market.
This data is also perfect for stress-testing your financial models. What happens to your cash flow if vacancy hits 8% instead of 5%? What if interest rates tick up another point? Running these scenarios is crucial.
- Model a few vacancy scenarios: 5%, 8%, and 10% to see the impact on your NOI.
- See how a 1-2% interest rate hike would affect your cash-on-cash return. It can easily shave off 0.5-1%.
Our agents at Edinhart can run these customized scenarios for you, so you know exactly what your risk exposure looks like.
Putting It All Together
Once you've gathered all your data, lay it out in a simple table to see the full picture.
| Data Point | Fresno Range | Global Benchmark |
|---|---|---|
| Avg Rent Per Month | $2,200–$2,500 | — |
| Cap Rate Estimates | 5%–6% | — |
| Avg Rental Yield | 5.5% | 6–7% (Dubai) |
| Seasonal Adjustment | +8-10% | — |
This simple summary immediately highlights where your potential investment stands, guiding both your offer price and your long-term rental strategy.
Working with Edinhart Realty & Property Management means you have a local expert in your corner to validate these numbers. We provide verified comps, the latest rent data, and the scenario testing you need to lock in a deal that truly works for you.
Stress Testing Your Investment for Realistic Returns

Running the numbers on a potential investment property is exciting, especially when they look good on paper. But a truly successful analysis doesn't stop with the best-case scenario. The real world rarely follows a perfect script, and that's where smart investors separate themselves.
This is where stress testing, also known as sensitivity analysis, comes in. It’s the critical process of running “what-if” scenarios to see just how resilient your investment is when things don’t go exactly as planned. This single step transforms you from a hopeful buyer into a strategic investor, ready for whatever the market throws your way.
Running Realistic What-If Scenarios
The heart of stress testing is all about asking the tough questions. You need to tweak the key variables in your spreadsheet to see how they impact your actual cash flow and long-term returns.
For example, instead of just assuming a tidy 5% vacancy rate, what happens if it jumps to 8% or even 10% because a major local employer relocates? It’s a real possibility, and a change like that can quickly turn a profitable property into one that’s costing you money every single month.
Here are the variables we always test:
- Increased Vacancy Rate: Don't just plan for a few weeks between tenants. Model what a few empty months would do to your gross income. It happens.
- Rising Interest Rates: If you're not locking in a fixed-rate loan, even a 0.5% bump in your interest rate can dramatically increase your debt service and shrink your cash flow.
- Unexpected Major Repairs: What’s your plan when the HVAC unit dies in the middle of a brutal Fresno summer? A sudden $8,000 expense can completely wipe out a year's worth of profit.
- Property Tax Increases: Taxes go up. It’s a fact of life. Factoring in a potential 5-10% increase in your annual property taxes is just good, prudent planning.
By putting your numbers through these scenarios, you'll discover the property's real break-even point and understand your margin for error. That knowledge is what allows you to invest with confidence. For a deeper dive into the numbers themselves, our guide on how to complete a rental property cash flow analysis is a great place to start.
Due Diligence Checklist for Fresno and Central California
Beyond the financial what-ifs, every market has its own quirks. A generic checklist you find online simply won’t cut it here in the Central Valley. For any investor looking at property in Fresno, Clovis, or the surrounding areas, a localized due diligence process is non-negotiable.
Our team at Edinhart Realty & Property Management always pushes clients to investigate these local factors:
- Water Rights and Restrictions: This is huge in our area. Especially for properties with large lots or agricultural potential, you absolutely must understand the local water situation.
- School District Boundaries: Never assume. Confirming a property is actually within a sought-after district like Clovis Unified can directly impact its rental demand and future value.
- Local Permit History: A quick trip to the city's records department can uncover unpermitted work that could become a massive headache and liability down the road.
- Neighborhood-Specific Factors: Is the area growing? Are there zoning changes on the horizon? What are the local crime stats? These things influence long-term appreciation.
Pro Tip: Get out of your car. Don't just rely on Zillow or Google Maps. Drive the neighborhood at different times of the day, on weekdays and weekends. Talk to the neighbors. This is the kind of on-the-ground intelligence a spreadsheet can never give you.
Mitigating Risks and Building a Resilient Portfolio
Stress testing isn't meant to scare you out of a good deal. It's about going into an investment with your eyes wide open. When you know where the vulnerabilities are, you can make a plan to address them.
Maybe it means setting aside a larger cash reserve for big-ticket repairs or choosing to invest in an area with a proven track record of low vacancy. This level of detailed analysis is more important than ever.
The global real estate market is bouncing back, with transaction volumes in the US seeing an 11.3% rebound last year. You can read more about it in PwC's global real estate outlook. This recovery presents fantastic opportunities, but it also means that careful, thorough risk assessment is what will set successful investors apart.
At Edinhart Realty & Property Management, we live and breathe this stuff. We help our clients perform this critical stress testing using our deep, hyper-local knowledge of the Fresno market to give them realistic numbers for their scenarios. Our goal is to make sure your analysis prepares you not just for the dream scenario, but for reality.
Pulling It All Together: Your Final Investment Decision
Alright, you've done the heavy lifting. You’ve wrangled the data, crunched the numbers, and even played devil's advocate with your own assumptions. Now for the moment of truth: making the final call on your real estate investment property analysis.
This is where the art meets the science. It’s not just about a pretty spreadsheet; it's about seeing if those numbers hold up against the reality of the neighborhood, the condition of the property, and the long-term potential of the market. A fantastic projected cash-on-cash return means nothing if it’s built on a shaky foundation, like a neighborhood with declining job growth. The real goal here is to make a confident, holistic decision, not just a mathematical one.
The Numbers vs. The Neighborhood
Your analysis has given you a set of powerful, objective guideposts—the NOI, cap rate, and cash-on-cash return that spell out the financial story. But numbers don't exist in a vacuum. They live in the real world, and that's where the qualitative factors, the "on-the-ground" intel, become absolutely critical.
Think of it like a final scorecard where you have to weigh both sides:
The Quantitative Side (The 'What'):
- Is this property actually going to put money in my pocket each month after all bills and the mortgage are paid?
- How does the cap rate stack up against other, similar properties for sale right now in Fresno?
- Does the ROI hit the personal benchmark I set for myself when I started this journey?
The Qualitative Side (The 'Why'):
- Neighborhood Vibe: Is this an up-and-coming area? Are new businesses opening, or are storefronts getting boarded up? What's the school situation like?
- Property Condition: We've accounted for immediate repairs, but what about the big-ticket items? An aging roof or a 20-year-old HVAC unit is a massive expense waiting to happen, and it can demolish your returns.
- The Ideal Tenant: Who are we renting to here? Is there strong demand from good, qualified tenants in this specific pocket of town? Keeping vacancy low is the name of the game.
The sweet spot is where both sides of this equation light up. Honestly, a property with just "okay" numbers in a neighborhood that's clearly on the rise might be a much smarter long-term play than a cash-flow monster in an area that's treading water.
The best investment decisions happen when a killer financial story is backed up by solid, on-the-ground fundamentals. If the spreadsheet screams 'yes' but your gut screams 'no' after driving the neighborhood, it's time to listen to your gut and dig deeper.
Your Go/No-Go Checklist
To keep emotion out of it, create a simple, non-negotiable checklist. What were your must-haves when you started?
Maybe it was a minimum 8% cash-on-cash return, a location within the Clovis Unified School District, and a property built after 1990. Now, score the property against your own rules.
This disciplined approach is your best defense against "deal fever." If the property only ticks one of your three boxes, it makes the decision to walk away clean and simple, no matter how much time you've sunk into the analysis.
You Don't Have to Make the Call Alone
This final step is precisely where having a seasoned local partner becomes a game-changer. An expert on the ground provides the context that you just can't find online. They can tell you if your rent estimates are realistic or pure fantasy, give you the real scoop on neighborhood trends, and help you accurately price out future repairs specific to Central California.
At Edinhart Realty & Property Management, we do more than just collect rent—we help investors make smarter, more confident decisions from day one. Our team is here to be your eyes and ears, bridging the gap between your spreadsheet and the street. We ensure your final decision is based on a complete, accurate, and realistic picture of the investment, giving you both strong financial returns and genuine peace of mind.
Answering Your Top Property Analysis Questions
Even with the best formulas and shiny new spreadsheets, you're going to have questions when you start digging into a potential investment property. It just comes with the territory. Working through these common sticking points is a huge part of the process, and getting the right answers can be the difference between a confident "yes" and a really expensive mistake.
Let's walk through some of the most frequent questions we hear from investors here in the Fresno area, whether they're buying their first rental or their fiftieth. Think of this as your field guide for handling the little details that a calculator can't solve on its own.
What Is a Good Cap Rate for an Investment Property in Fresno?
There's no single magic number, but here in Fresno and Clovis, most savvy investors are looking for a cap rate somewhere between 5% and 8%. The "right" cap rate for you really comes down to the specific property and what you're trying to achieve with your portfolio.
For instance, a lower cap rate around 5% might be a fantastic deal on a newer, turnkey home in a top-tier neighborhood with a ton of upside for appreciation. On the flip side, an older property that needs some love or sits in a less sought-after area really needs to offer a higher cap rate—think 7% or 8%—to make the extra risk and headache worthwhile.
Here's the key: stop comparing a Fresno property to some national average you read online. A good cap rate is one that stacks up well against similar properties that have recently sold right here in our local market. That's the only comparison that matters.
How Much Should I Budget for Vacancy and Repairs?
A great rule of thumb is to set aside 5-10% of your gross scheduled income for vacancies and another 5-10% for repairs and maintenance. Where your property falls in that range is all about its age and current condition.
- For a newer home, maybe built in the last 10-15 years, you can probably lean closer to the 5% mark for both categories and sleep just fine at night.
- But for an older house with its original roof or an HVAC unit that's seen better days? You'd be wise to budget the full 10% for repairs. It’s a much safer, more conservative approach.
In the Central Valley, the condition of the HVAC system and the roof are two of the biggest budget-busters. A professional home inspection is non-negotiable; it will give you the real-world data you need to dial in these numbers.
Can I Do a Property Analysis Without a Real Estate Agent?
You absolutely can. With all the online calculators and spreadsheet templates available, running the numbers yourself is easier than ever. The real challenge, and where most DIY analyses fall apart, is the quality of the data you're plugging in.
Your entire real estate investment property analysis is only as good as the inputs you use.
Getting accurate, up-to-the-minute local data for market rents, realistic operating costs, and solid comparable sales is incredibly difficult without access to the MLS and years of on-the-ground experience. Working with a local expert isn't about someone else doing the math for you; it's about having a professional who can vet your assumptions and make sure your analysis is grounded in reality, not just wishful thinking.
What Are the Most Common Mistakes in Property Analysis?
By far, the number one mistake is being way too optimistic. It's so easy to fall into this trap. Investors constantly underestimate their expenses (especially the big-ticket capital expenditures), overestimate what the property will rent for, and—the classic rookie move—assume a 0% vacancy rate.
Another huge error is completely ignoring the qualitative stuff. These are the things that don't fit neatly into a spreadsheet cell, like shifting neighborhood dynamics, a big rezoning project happening down the street, or the reputation of the local school district. A truly bulletproof analysis uses conservative numbers and includes stress tests to see how the deal holds up when things don't go perfectly.
Answering these questions correctly is how you turn a decent analysis into a fantastic investment. If you're looking for an expert eye to validate your numbers and provide the local insights that data alone can't give you, Edinhart Realty & Property Management is here to help. We make sure your analysis is rock-solid, realistic, and sets you up for success. Learn more about our investment property services.


