

Occupancy alone can make a rental portfolio look healthy while hiding weak collections, expensive turnover, slow leasing, deferred maintenance, or poor profitability. A unit can be occupied but still produce weak net effective rent after concessions, generate repeated repair costs, or lose income through late payments. That's why property management KPIs work best as a connected operating system, not as isolated figures.
Leasing metrics explain how income is generated. Tenant metrics reveal whether that income is likely to continue. Maintenance indicators show where operating costs and resident frustration are building. Financial KPIs then show what remains for the owner. Leading indicators, such as tenant satisfaction and property condition, can warn of trouble before it appears in lagging outcomes such as ROI.
For owners in Fresno, Clovis, Friant, and nearby Central California communities, the value lies in turning those signals into action. Edinhart's reporting, automated rent collection, repair coordination, leasing services, and financial statements give owners a practical way to connect daily operations with investment performance. Owners who need a broader operating partner can also review short-term rental management assistance, then compare the service model with their own portfolio needs.
1. Occupancy Rate
Occupancy rate measures the share of available units that are leased and producing rental income during a defined period.
Formula: Occupied units ÷ total available units × 100
The metric is foundational because an empty unit usually produces no rent while still creating administrative, marketing, and maintenance work. A portfolio with strong occupancy has a better starting point for stable revenue, but occupancy by itself doesn't prove that the portfolio is profitable. Managers also need to examine collection performance, concessions, turnover costs, and the time required to lease each vacancy.
A commonly used benchmark is vacancy below 5%, which corresponds to roughly 95% occupancy in many markets, while a cited national rental vacancy rate is 7.3%, or approximately 93% occupied. The same industry guidance identifies stabilized occupancy targets between 94% and 96%. These figures provide context, not a universal target, because property type, location, seasonality, pricing, and unit condition all affect performance. ManageCasa's property management KPI guidance explains why owners should read occupancy alongside revenue stability.
Read occupancy with vacancy duration
A high occupancy rate can conceal a recurring problem if the same units remain vacant for long periods between tenants. Conversely, slightly lower occupancy may reflect deliberate improvements to property condition or rent quality. The useful question is not whether units are filled, but whether they're filled at sustainable terms.
Edinhart-informed action starts with a property-level report that separates occupied units, notice units, available units, and days vacant. Professional photography, accurate pricing, applicant screening, and coordinated showings can support stronger leasing decisions, while detailed owner reporting helps identify whether a weak result comes from demand, presentation, pricing, or execution.
2. Rent Collection Rate
Rent collection rate measures the rent received against the rent billed for the same period.
Formula: Rent collected ÷ rent billed × 100
This KPI translates signed leases into usable cash flow. Occupancy tells an owner that a unit is leased. Collection rate tells the owner whether the lease is producing the expected income. A portfolio with strong occupancy and weak collections can still experience cash shortages, delayed vendor payments, and misleading revenue forecasts.
Track the metric by property and by tenant account. A portfolio-level result can hide a small group of recurring late payments, while a property-level result can reveal communication, screening, or payment-process problems. Managers should also separate timing issues from true delinquency. A payment that arrives late in the reporting cycle may require a different response from a balance that remains unpaid.
Practical rule: Pair collection rate with the reason for every variance, such as a payment-processing issue, an approved arrangement, a disputed charge, or an unresolved delinquency.
Edinhart's automated rent collection process can help owners reduce manual follow-up and create a clearer record of payment activity. The operating response should include consistent lease terms, documented reminders, prompt contact after missed payments, and lawful escalation procedures. Tenant screening remains relevant before the lease begins, but collection reporting shows whether the chosen process is working after move-in.
For a practical framework on payment procedures and follow-up, owners can review how to collect rent from tenants. The most useful report doesn't merely display a percentage. It shows what was billed, what was received, what remains outstanding, and what action has been assigned.
3. Tenant Turnover Rate
Tenant turnover rate measures how frequently occupied units become vacant and require replacement tenants during a defined period.
Formula: Move-outs ÷ total units × 100
Turnover affects several operating lines at once. A move-out can create lost rent, marketing work, inspection requirements, cleaning, repairs, leasing coordination, and administrative time. That makes turnover a bridge between tenant experience and owner economics. A property with recurring move-outs may not have a leasing problem at all. It may have a maintenance, communication, pricing, or expectation-setting problem.
Use move-out reasons as supporting evidence. If residents repeatedly mention slow repairs, poor communication, or unexpected rent changes, the turnover rate is a symptom rather than the diagnosis. Compare results by property, unit type, lease expiration period, and reason for departure. An owner may discover that portfolio-wide turnover looks stable while one property creates a disproportionate share of make-ready work.
Turnover is more useful when paired with cost
A low turnover rate isn't automatically positive if the manager retains tenants through excessive concessions or under-market pricing. A higher rate may be rational when a property needs repositioning, provided the owner understands the effect on vacancy days, rent quality, and repair spending.
Edinhart's tenant retention strategies can support earlier renewal communication, responsive maintenance coordination, and clearer resident contact. Owners should also use prevent vacancies with smart screening as a related operational principle, while recognizing that screening prevents poor matches and doesn't replace good service after move-in.
The action plan is straightforward. Record the reason for each move-out, review the associated turn cost, contact renewing tenants before the decision becomes urgent, and assign a responsible person to every recurring complaint.
4. Average Rent Per Unit
Average rent per unit shows the mean rental income generated by each unit in a selected property or portfolio.
Formula: Total scheduled rent or collected rent ÷ number of units
The formula is simple, but the interpretation requires care. Scheduled rent measures pricing on the lease ledger. Collected rent measures realized cash. Net effective rent goes further by accounting for concessions, discounts, downtime, and other reductions. Owners should define which version they're tracking before comparing properties.
Consider two properties with the same average rent per unit. One may achieve that result through stable renewals and limited concessions. The other may reach it through aggressive asking rents but lose income during extended vacancy periods. The second property looks stronger in a basic rent report, yet may produce weaker operating results.
Average rent is a pricing signal, not a profitability verdict.
Edinhart's local leasing context can help owners compare rent positioning with property condition, presentation, demand, and tenant retention. Professional photography, staging, interior improvements, and accurate listing descriptions can improve how prospective tenants understand a home's value. Those activities shouldn't be judged only by whether they support a higher asking rent. They should also be evaluated against vacancy risk, renewal behavior, and the cost of preparing the unit.
Track average rent by unit type, neighborhood, property condition, lease cohort, and renewal status. Then compare market rent with tenant rent and net effective rent. If a rent increase would produce a small gain but trigger a costly move-out, the better decision may be to preserve a reliable tenancy while improving the property gradually.
5. Property Condition Index
A Property Condition Index, or PCI, is a structured assessment of a rental property's physical condition, appearance, systems, and maintenance needs.
Because no universal PCI scale applies to every portfolio, owners should define their own scoring method and document the criteria. A useful assessment can cover exterior condition, interior finishes, plumbing, electrical systems, heating and cooling, appliances, safety features, curb appeal, and unresolved work orders.
Turn observations into capital decisions
A condition score becomes valuable when it changes what the manager does next. A property with sound systems but dated finishes may need a planned improvement program. A property with repeated emergency repairs may need capital replacement rather than another isolated fix. A home with good physical condition but weak presentation may need better photography, staging, or listing copy rather than major construction.

Edinhart's inspection reports, photos, move-in and move-out documentation, and maintenance updates can give owners evidence behind a condition assessment. The score should never replace the underlying report. Owners need to see what changed, why it changed, and whether the recommended work protects safety, supports retention, reduces future repairs, or improves rent positioning.
A practical action plan includes scheduled inspections where permitted, preventive maintenance based on system age and condition, prompt handling of tenant-reported issues, and a written distinction between routine repairs and capital improvements. The strongest condition KPI is not a polished score. It's a reliable record that helps an owner spend at the right time.
6. Lease Renewal Rate
Lease renewal rate measures the percentage of expiring leases that result in a renewed tenancy.
Formula: Renewed leases ÷ leases expiring during the period × 100
This is a retention metric, but it also tests the full service experience. Residents decide whether to renew based on rent, property condition, maintenance responsiveness, communication, neighborhood fit, and confidence in the management process. A renewal report therefore deserves more than a single percentage. It should include the rent change, the reason for non-renewal, open maintenance issues, and the timing of the renewal offer.
A renewal rate can look favorable while hiding weak economics. For example, a manager may retain residents by accepting concessions or delaying needed improvements. Conversely, a lower renewal result may reflect a deliberate pricing correction or a planned renovation. Interpretation depends on the surrounding data.
Start before the lease reaches its final weeks
Edinhart can support renewal coordination through tenant communication, maintenance follow-up, lease administration, and owner reporting. The action plan should identify upcoming expirations early, review the resident's payment and maintenance history, inspect unresolved issues, and present clear renewal terms. The manager should also record every non-renewal reason in a consistent category so owners can identify patterns across properties.
A resident who receives prompt answers and sees repairs handled professionally has a stronger reason to stay, but retention still depends on fair expectations. Owners should compare renewal rent with market positioning, turnover cost, expected vacancy duration, and the resident's payment history rather than pursuing the highest possible increase in isolation.
7. Return on Investment
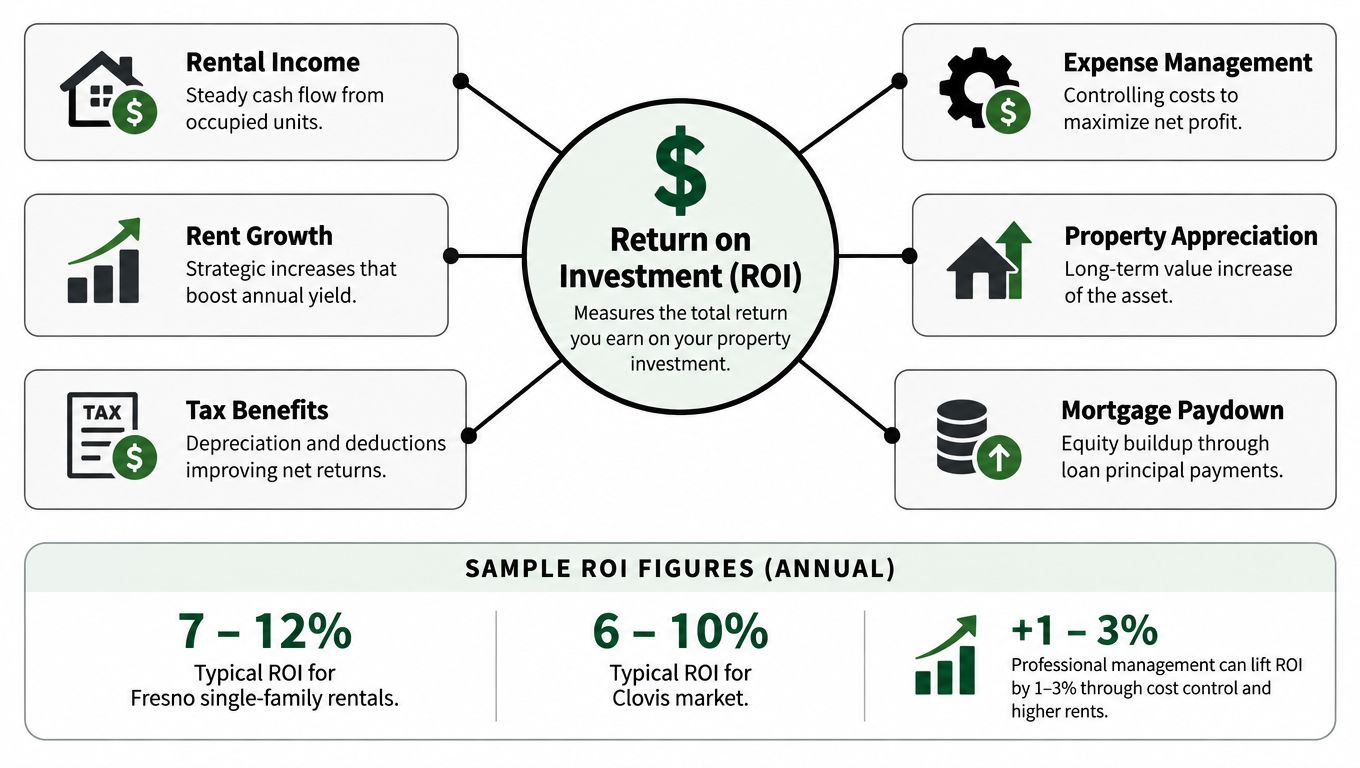
Return on investment measures the profit generated in relation to the capital invested in a property.
Formula: Net profit ÷ invested capital × 100
ROI is a lagging outcome. It reflects the combined effect of rent, collections, occupancy, expenses, maintenance, turnover, financing assumptions, and capital decisions. That makes it useful for owner-level evaluation, but less useful for diagnosing a problem by itself.
A falling ROI doesn't automatically mean leasing performance has weakened. The cause could be insurance, taxes, repair costs, vacancy, concessions, financing, or an inaccurate allocation of expenses. Likewise, a higher ROI may result from deferred maintenance that temporarily reduces spending while increasing future risk.
Owner-level interpretation: Use ROI to decide whether the investment is meeting its purpose, then use the operating KPIs to explain why.
Owners should define whether they're measuring cash-on-cash return, property-level operating return, or a broader return that includes appreciation. Those measures answer different questions and shouldn't be blended into one unexplained figure. Accurate financial statements are essential because incomplete expenses can make the result appear stronger than it is.
Edinhart's rental property ROI calculator can help frame the calculation, while monthly statements and owner reporting can supply the operating inputs. The action plan is to review ROI alongside occupancy, collection rate, average rent, maintenance cost, and turnover. If the result weakens, assign the variance to a specific operating category before considering a hold, sell, refinance, or improvement decision.
8. Maintenance Cost Per Unit
Maintenance cost per unit measures the average repair and upkeep spending assigned to each rental unit during a defined period.
Formula: Total maintenance spending ÷ number of units
This KPI should include a clear accounting policy. Owners may track routine repairs separately from capital improvements, tenant-caused damage, inspections, make-ready work, emergency callouts, and preventive maintenance. Without that separation, a property undergoing a planned upgrade can appear inefficient even though the spending serves a different purpose.
The number becomes more informative when paired with work-order type, response time, recurrence, property age, and condition. A low maintenance total may signal effective preventive work, or it may indicate that tenants aren't reporting problems, vendors haven't invoiced yet, or necessary repairs are being deferred. A high total may reflect poor property condition, but it may also represent a deliberate investment that prevents larger failures.
Cost control should not reduce service quality
Edinhart's repair coordination can help route requests, manage vendors, provide status updates, and document completed work through owner reporting. The manager should review repeated work orders, compare repair versus replacement decisions, separate resident damage from ordinary wear, and create a preventive schedule for major systems.
A useful monthly review asks four questions:
- What was repaired: Group spending by system and work type.
- Why was it needed: Identify failure, wear, resident damage, or planned improvement.
- Did the repair recur: Repeated work may justify replacement or a deeper inspection.
- What did the resident experience: Slow or incomplete repairs can affect satisfaction and renewals.
The economic objective isn't the lowest maintenance number. It's controlled spending that protects the asset, supports safe occupancy, and prevents avoidable turnover.
9. Days to Lease
Days to lease measures how long a vacant unit remains available before a new lease is signed.
Formula: Total vacant days for leased units ÷ number of leased units
This leading operational metric connects marketing, pricing, property condition, showing availability, applicant screening, and lease preparation. A long leasing period can reduce income, but a rushed placement can create later collection or turnover problems. Speed only helps when the new tenancy also meets the owner's quality and risk requirements.
A practical benchmark in many markets is keeping average days to lease under 30 days, while vacancy above 8% to 10% is often treated as a leasing performance concern. AMBS Call Center's property management KPI guidance presents these benchmarks as practical reference points, not universal rules. Local demand, seasonality, unit type, price, condition, and compliance requirements still matter.

Diagnose the delay instead of cutting rent first
Track the date the unit became available, the listing date, inquiry volume, showing activity, applications, approval, and lease execution. If inquiries are weak, presentation or pricing may be the issue. If showings occur but applications don't, condition, terms, or screening expectations may be misaligned. If an approved applicant stalls before signing, communication or lease preparation may be slowing the process.
Edinhart's professional photography, staging, marketing, applicant screening, and lease drafting can support a more coordinated placement process. The action plan should set a response standard for inquiries, publish across appropriate channels, price from current comparable evidence, and review the listing quickly when activity doesn't match expectations.
10. Tenant Satisfaction Score
Tenant satisfaction score measures how residents evaluate the property, maintenance experience, communication, payment process, and overall management relationship.
Formula: Total survey score ÷ number of completed responses
Owners should define the survey scale, questions, response period, and minimum interpretation rules. A single score can be distorted by a small or unrepresentative response group, so managers should review written comments, response volume, property, unit, issue type, and trend over time.
Satisfaction is a leading indicator because residents often experience management problems before those problems appear in turnover or collection reports. Repeated complaints about communication may point to a process failure. Recurring maintenance complaints may indicate condition problems. Confusion about charges may reveal a lease or accounting communication issue.
Residents don't experience a KPI dashboard. They experience whether the manager answers, explains, and follows through.
Edinhart can support this measurement through tenant communication, maintenance coordination, an online owner portal, and documented repair updates. A useful survey asks specific questions about response quality, repair completion, property condition, clarity of communication, and renewal intent. Managers should assign an owner to each recurring issue, record the corrective action, and report back to owners rather than treating survey results as passive feedback.
The cautious interpretation matters. Satisfaction doesn't guarantee renewal, on-time payment, or lower costs. It does give managers an early view of friction that may later affect those outcomes. Used with turnover, renewal, maintenance, and collection data, it becomes a decision tool rather than a reputation score.
Top 10 Property Management KPI Comparison
| Metric | 🔄 Implementation Complexity | ⚡ Resource Requirements | 📊 Expected Outcomes | 💡 Ideal Use Cases | ⭐ Key Advantages |
|---|---|---|---|---|---|
| Occupancy Rate | Low, simple % calculation | Low, PMS data, monthly reporting | Clear view of revenue capacity and vacancy trends | Portfolio performance monitoring; benchmarking | Simple to calculate; easy benchmarking; direct revenue indicator |
| Rent Collection Rate | Low–Medium, requires payment reconciliation | Medium, payment platform, accounting, collections process | Predictable cash flow; early delinquency detection | Cash-flow management; tenant screening effectiveness | Improves cash flow; reduces delinquencies; actionable for interventions |
| Tenant Turnover Rate | Medium, track move-outs and causes | Medium, move-out records, surveys, rehabbing cost tracking | Forecasts vacancy, rehab costs, and retention needs | Retention strategy; budgeting for turnover expenses | Highlights retention issues; helps reduce vacancy and rehab costs |
| Average Rent Per Unit | Low, aggregate rents ÷ units (adjust for mix) | Low–Medium, rent roll, market comps, segmentation | Pricing insight; identifies revenue optimization opportunities | Pricing strategy; market positioning; investor reporting | Guides pricing decisions; easy to communicate to investors; benchmarkable |
| Property Condition Index (PCI) | Medium–High, requires standardized inspections | High, trained inspectors, inspection schedules, reporting tools | Predicts capital needs; supports pricing and retention | Capital planning; preventive maintenance prioritization | Proactive maintenance; protects asset value; reduces emergency repairs |
| Lease Renewal Rate | Low–Medium, track renewals vs expirations | Medium, lease management system, tenant outreach | Predicts turnover; reduces replacement costs | Retention programs; lease-renewal planning | Much lower cost than turnover; income predictability; retention indicator |
| Return on Investment (ROI) | High, comprehensive financial calculations | High, full accounting, valuations, market inputs | Holistic measure of investment performance and comparability | Investment evaluation; buy/hold/sell decisions; investor reporting | Comprehensive profitability metric; guides portfolio allocation |
| Maintenance Cost Per Unit | Medium, requires cost categorization by unit | Medium, vendor invoices, maintenance tracking, historical data | Controls repair spending; flags high-cost properties | Budgeting; decide capital improvements vs repairs | Visibility into operating costs; informs preventive maintenance decisions |
| Days to Lease | Low–Medium, track vacancy and leasing duration | Medium, marketing metrics, listing channels, process speed | Measures marketing effectiveness; estimates lost rent days | Leasing strategy; marketing channel evaluation | Shortens vacancy periods; improves speed to revenue |
| Tenant Satisfaction Score | Medium, needs survey design and follow-up | Medium, survey tools, response collection, staff action | Leading indicator of renewals, complaints, and service gaps | Service improvement; retention initiatives; reputation management | Direct tenant feedback; guides operational improvements; correlates with retention |
Turn KPI Tracking Into Better Property Decisions
Ten metrics become useful when they form a monthly scorecard with clear ownership. Group occupancy rate, rent collection rate, average rent per unit, and days to lease under income generation. These metrics show whether units are available, leased, priced appropriately, and converting into collected revenue. Review them together because a high occupancy result can still hide weak collections, concessions, or long vacancy periods between leases.
Group tenant turnover rate, lease renewal rate, and tenant satisfaction score under retention. These indicators explain whether residents are staying, why they leave, and what they experience before making that decision. Review move-out reasons beside renewal offers, maintenance complaints, payment history, and communication records. A retention problem often appears first in satisfaction comments or unresolved work orders, then later in renewal and turnover results.
Group Property Condition Index and maintenance cost per unit under cost control. A condition assessment helps owners plan work before failures become emergencies. Maintenance spending shows what the property is consuming, but it needs categories and context. Review recurring repairs, preventive work, capital improvements, resident damage, vendor performance, and resident experience in the same discussion.
Use ROI as the owner-level outcome. It doesn't replace the operating metrics. It summarizes their combined financial effect and helps owners evaluate whether the asset is performing as intended. When ROI changes, the scorecard should show which operating result caused the movement and what decision follows.
A practical reporting rhythm has four parts:
- Set one target: Define the desired direction and measurement method for each KPI.
- Assign one owner: Name the person responsible for reviewing the metric and initiating action.
- Review trends by property: Compare the current result with the property's own history and relevant local context, not just a portfolio average.
- Document the response: Record the variance, likely cause, selected action, responsible person, and follow-up date.
Edinhart's full-service model can support this process through automated rent collection, tenant communication, repair coordination, move-in and move-out reporting, inspection documentation, monthly financial statements, and owner-portal access. Owners who choose placement-only service can still use the same framework while retaining responsibility for daily operations. The important distinction is accountability. A dashboard that no one acts on is only an archive of past activity.
Start with a manageable scorecard and improve its definitions as the portfolio produces better records. Don't chase every available data point. Choose the measures that connect leasing, resident experience, condition, cost, and investment performance, then use each variance to trigger a specific operating decision.
Edinhart Realty and Property Management offers full-service management with rent collection, tenant communication, repair coordination, lease renewals, move-in and move-out coordination, and financial reporting, along with placement-only leasing, marketing, screening, and lease drafting. Visit Edinhart Realty and Property Management to discuss how a connected KPI reporting process can support your Fresno, Clovis, Friant, or Central California rental portfolio.


