

Before you get too attached to that charming Craftsman with the perfect front porch, you need to look at what’s happening in the neighborhood. Digging into local crime information is one of the most important steps you can take, and it goes way beyond just curb appeal.
This data tells the real story of a neighborhood—patterns of property crime, violent incidents, and other trends that give you the power to make a truly informed decision.
Why Crime Data Is a Home Buyer's Best Friend
Getting a clear picture of the area isn't just about feeling safe. It's a critical financial move. The crime stats in a neighborhood directly impact property values, how much you'll pay for home insurance, and your day-to-day peace of mind.
Don't think of this research as a chore. See it as essential due diligence that protects both your family and your financial future.
The Financial Impact of Neighborhood Safety
Crime rates have a very real, tangible effect on your wallet. It's simple supply and demand. A neighborhood with a solid reputation for safety will naturally attract more buyers, which helps property values appreciate steadily over time.
On the flip side, areas with a noticeable uptick in crime can see home values stagnate or even decline. That puts your entire investment at risk.
Insurance companies are paying close attention, too. They crunch local crime numbers to set their premiums, and a higher rate of theft or vandalism in an area almost always means you'll pay more for homeowner's insurance. Over a 30-year mortgage, those higher premiums can easily add up to thousands of extra dollars.
A home isn't just a place to live; it's one of the largest financial assets most people will ever own. Protecting its value by understanding the surrounding environment is a non-negotiable part of the buying process.
Beyond the Numbers: Daily Peace of Mind
The data on a spreadsheet translates directly into your quality of life. A string of package thefts might sound like a small thing, but it quickly becomes a constant headache. More serious trends, like frequent car break-ins or assaults, can create a background hum of stress you just don't need.
Knowing these details ahead of time allows you to be proactive. For instance, if you know property crime is a local issue, you can explore effective strategies to increase home security before you even move in. This knowledge turns vague worries into an actionable plan.
For families, safety is deeply connected to other priorities. In fact, there's often a strong link between the quality of local schools and the safety of a neighborhood. You can learn more about how schools and real estate influence each other in our detailed guide.
Ultimately, analyzing crime data helps you find a community where you can genuinely relax and feel at home. It’s about building a life in a place that supports your well-being, not just one that looks good in the listing photos.
Finding Reliable Local Crime Information Online
Trying to find accurate crime information online can feel like you're drinking from a firehose. A quick search turns up dozens of sites, but if you want a true picture of a neighborhood, you have to start with official, reputable sources. I always tell my clients that primary sources are non-negotiable.
Your first click should always be the website for the local police department or sheriff’s office for the area you're researching. More and more departments are putting up public crime dashboards or data portals. This is your best shot at getting the most current, unfiltered data straight from the source.
Top Sources for Local Crime Data
Once you have the official local data, you can broaden your search with user-friendly platforms that pull information from thousands of different law enforcement agencies. These are fantastic for getting a bird's-eye view or quickly comparing one neighborhood to another. It's all about layering different types of data to see the full picture.
Here’s a quick rundown of the tools I find most reliable, each with its own strengths and weaknesses.
| Data Source | Type of Information | Best For | Potential Drawback |
|---|---|---|---|
| Local Police/Sheriff Dept. | Raw incident reports, dashboards | Getting the most current, granular data for a specific jurisdiction. | Data can be hard to interpret without context; not great for comparing areas. |
| FBI Crime Data Explorer | High-level national/state stats | Understanding broad crime trends and establishing a baseline for comparison. | Not useful for street-level or neighborhood-specific analysis. |
| CrimeMapping.com | Interactive map of recent incidents | Visualizing real-time activity and identifying crime hotspots in specific areas. | Relies on participating agencies, so some areas may have incomplete data. |
| NeighborhoodScout | Detailed reports, risk scores | Deep-dive analytics and predictive modeling for a comprehensive risk profile. | It's a subscription-based service, so there's a cost involved. |
No single source tells the whole story. The real magic happens when you combine the raw data from local police with the broader context from a national database and the visual insights from a mapping tool.
This infographic breaks down annual crime incidents, showing the split between property and violent crimes over the last three years.
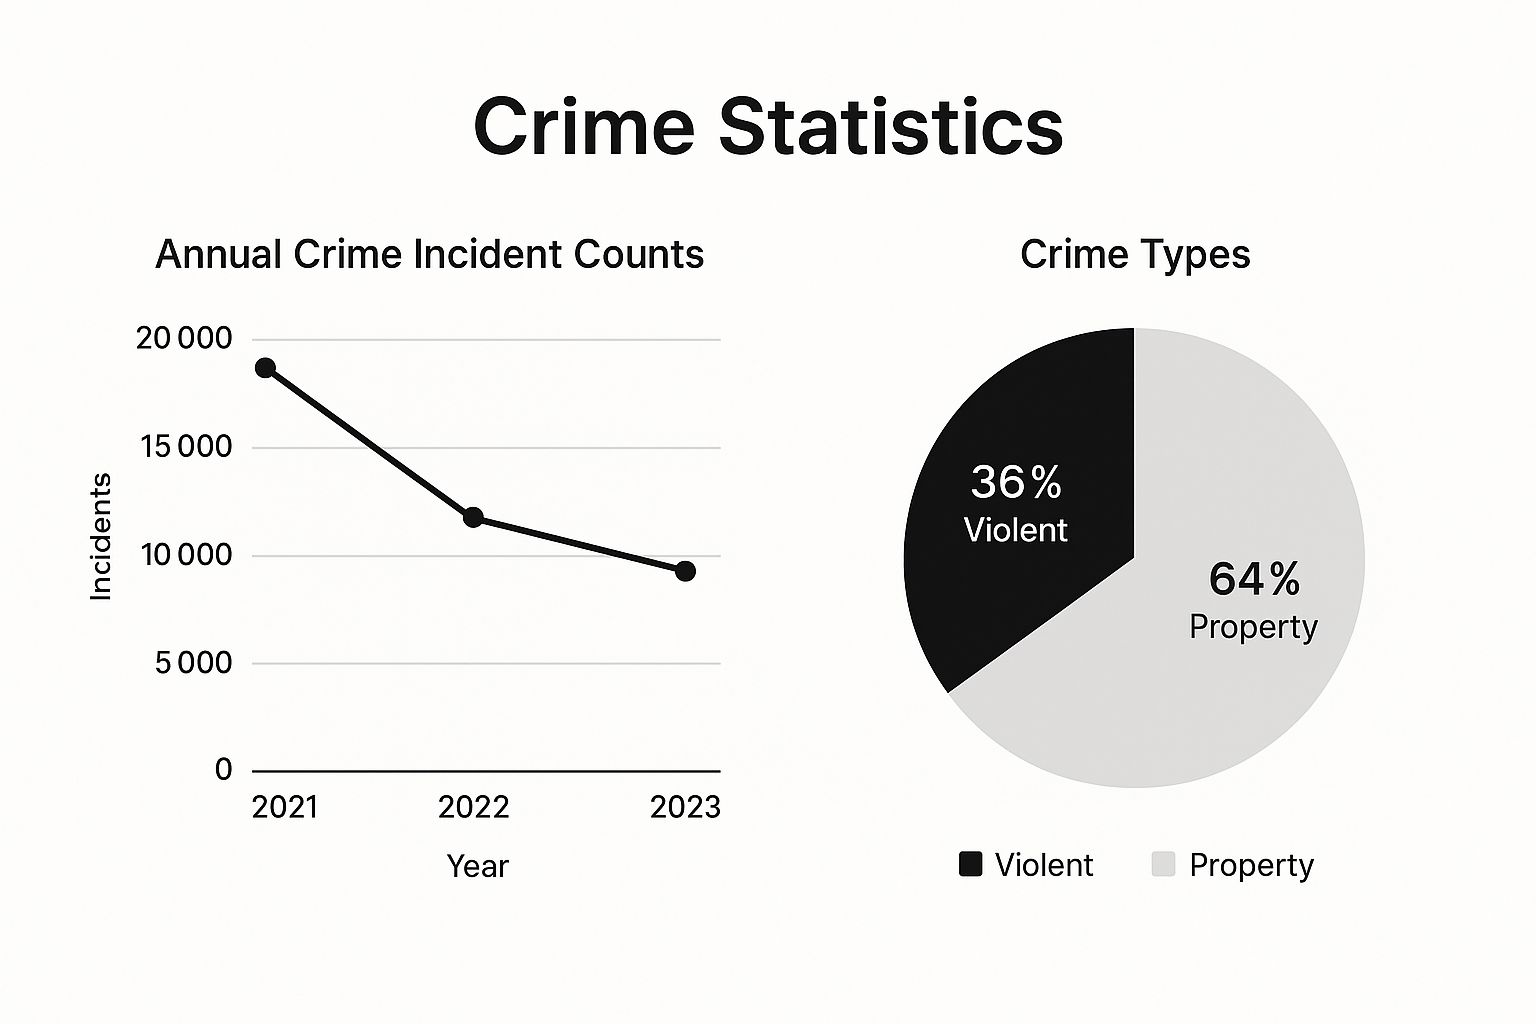
You can clearly see that while the total number of incidents has been trending down, property crime continues to be the overwhelming majority of cases. That's a key piece of context.
How to Get the Most Out of Crime Mapping Tools
Okay, let's talk about tools like CrimeMapping.com. Don't just pull up the map and glance at it. You need to dig in. These platforms give you filters for a reason—use them to narrow down the date range and the specific types of offenses you’re most concerned about. This is how you zero in on what truly matters for your decision.
The image below gives you an idea of what you're looking at. You get a map of the neighborhood with little icons marking specific incidents.
The real value is in clicking those icons. You can often see the type of crime, a case number, and a general location. This is how you move past just seeing a statistic and start understanding what's happening on a specific street.
Pay close attention to where the incidents are clustered. Are all the car break-ins happening near a big shopping center, or are they scattered through the quiet residential streets? That distinction is huge.
Pro Tip: Always cross-reference what you find on a third-party site with the local police department’s own reports. Sometimes there are reporting delays or discrepancies. Comparing the two is the only way to be confident you have the most complete and accurate information.
It also helps to have some global context. For example, we often hear about violent crime, but the data usually shows it's highly concentrated in specific urban hot spots. A fascinating case is El Salvador; it once had one of the highest homicide rates in the world, but recent policy changes have caused a dramatic drop. You can explore more of these kinds of global crime statistics on Statista.com.
Ultimately, your goal is to pull together information from several good sources. When you combine official local reports with mapping tools and national data, you build a layered, nuanced understanding of a neighborhood's safety. It’s this multi-faceted approach that gives you the confidence to properly assess an area.
How to Actually Read Crime Maps and Statistics

Staring at a heat map full of red splotches or a spreadsheet of crime stats can feel pretty overwhelming. Without the right lens, those numbers and colors are just data points. They don't tell you what it’s actually like to live on that street or in that neighborhood.
The real skill is learning to read between the lines and understand the story the data is trying to tell. This is the moment you stop just gathering local crime information and start turning it into genuine insight that can guide your decision.
Differentiating Crime Types
First thing's first: you have to understand the language. Crime reports lump everything together, but not all crimes are created equal. Getting a handle on the major categories is crucial for an accurate assessment.
- Violent Crimes: These are the serious offenses against a person—think assault, robbery, and homicide. While they are deeply concerning, they're often less frequent than property crimes but obviously carry enormous weight when you're thinking about personal safety.
- Property Crimes: This bucket includes things like burglary, car theft, and arson. These are the crimes that directly hit your sense of security at home and often make up the bulk of a neighborhood's crime statistics.
For example, a neighborhood with a high rate of car break-ins near a busy shopping district has a completely different risk profile than one with a lower overall rate but a string of violent assaults. You have to filter the data to see what’s really happening.
A common mistake is to look at the overall crime rate as a single, scary number. The real understanding comes from breaking it down. Are the issues frequent but minor property crimes, or are they less frequent but far more serious violent acts?
The Power of Context and Comparison
A single statistic in a vacuum is almost meaningless. A report showing 50 burglaries in a neighborhood last year might sound bad, right? But what if the average for a similar area across town is 150? All of a sudden, that number doesn't look so alarming.
Context is everything.
You should always weigh the local crime information for your target neighborhood against a few key benchmarks:
- The Broader City: Is this neighborhood higher or lower than the rest of the city?
- State and National Averages: This gives you the widest possible view. It helps you see if local trends are just part of a much bigger pattern.
- The Last Few Years: How does this year's data compare to the last three to five years for the same neighborhood? Is burglary trending up, holding steady, or—ideally—going down? A downward trend is a fantastic sign.
This comparative approach helps you calibrate your expectations and spot what’s a genuine red flag versus what's just noise. For a bit of perspective, the United States had a homicide rate of roughly 5.76 per 100,000 people in 2023. This is just a hair above the global average, which has been slowly declining. You can dig into some fascinating global homicide rate comparisons on Wikipedia.
Looking Beyond Simple Rates
Finally, don't just stop at the crime rate per capita. You need to look at where the crimes are happening. A cluster of shoplifting incidents around a mall doesn't automatically mean the residential streets three blocks away are unsafe.
Use crime maps to pinpoint the actual location of incidents. More often than not, you'll see that crime is concentrated around specific places like major bus stations, big retail centers, or a strip of bars and nightclubs. Understanding these nuances gives you a much more realistic—and often less intimidating—picture of what a neighborhood is truly like.
Go Beyond the Data with On-the-Ground Research
A spreadsheet can show you reported incidents, but it will never tell you how a neighborhood actually feels. The numbers you’ve collected are a critical starting point, but they’re missing the human element. This is where getting your boots on the ground becomes your most powerful tool.
Simply put, you need to go there. Your mission is to see the neighborhood through the eyes of someone who lives there, not just as a prospective buyer staring at a listing. That means visiting multiple times to see its different personalities.
The Two-Visit Rule
A neighborhood can feel like a totally different place on a quiet Tuesday morning versus a hopping Friday night. To get the full picture, you need to experience both.
The Weekday Morning Visit: Plan a trip on a Tuesday or Wednesday morning. This is your chance to see the neighborhood's baseline—how it operates on a completely normal day. Are the streets clean? Are people out walking dogs and jogging? Do you see signs of community pride, like well-tended gardens or kids playing in the local park?
The Weekend Evening Visit: Now, circle back on a Friday or Saturday night. This visit reveals the area’s social dynamic. Does it feel vibrant and lively, or does it tip over into uncomfortably rowdy? Pay close attention to noise levels, the vibe around local bars or restaurants, and how safe the streets feel after dark.
This two-visit strategy is non-negotiable. It's the only way to know if a "quiet street" is genuinely peaceful or just biding its time before the weekend nightlife kicks into gear. One visit only ever tells you half the story.
What to Look For Beyond the Obvious
As you walk or drive around, keep your eyes peeled for the subtle clues that data maps can't possibly show you. These little details often paint a far more accurate picture of a community’s health and safety than raw statistics ever could.
Look for the good stuff—signs that point to a strong, engaged community:
- Maintained public spaces: Are the parks, sidewalks, and community centers clean and in good repair?
- Neighborhood watch signs: This can be a great signal of an active and vigilant community looking out for each other.
- Home upkeep: Do the homes and yards look cared for? It suggests residents have a real sense of pride in their properties.
At the same time, stay alert for potential red flags:
- Widespread disrepair: Keep an eye out for excessive graffiti, broken windows, or overflowing trash cans.
- Bars on windows: While pretty common in some urban areas, a heavy concentration can indicate a higher level of resident concern about security.
- Poor lighting: Dark streets and unlit alleyways can create an environment where crime is more likely to happen.
Talk to the Locals
Honestly, the best source of unfiltered information comes straight from the people who live and work there every single day. Strike up a casual conversation with a barista at the corner coffee shop, a local shop owner, or even someone out walking their dog.
You don’t need to conduct a formal interview. Just ask simple, open-ended questions like, "What's it like living around here?" or "How's the neighborhood been lately?" Their candid insights are the essential human layer to your research, either confirming or challenging what the crime data suggests. This is the final piece of the puzzle.
Turning Your Research into a Confident Home Offer

You’ve done the legwork. You’ve gathered the data, walked the streets, and gotten a feel for the area. Now for the most important part: turning all that research into a clear, confident decision. This is the moment you balance the local crime information you've uncovered against everything else on your list—school districts, commute times, and the home's features.
There isn't a magic number that makes a neighborhood "safe enough." It really comes down to your personal comfort level and what you're willing to live with. A neighborhood with a higher-than-average rate of package theft might be perfectly fine if the home has a secure entryway or porch. On the other hand, if you’ve seen a pattern of car break-ins, a property with a locked garage suddenly moves from a "nice-to-have" to a must-have.
Defining Your Comfort Zone
Your research allows you to build a practical checklist based on facts, not just feelings. If your target area has low violent crime but consistent petty theft, your focus sharpens. You’re no longer just looking for a house; you’re looking for a house with specific security features that address that particular issue.
This data-driven approach is a game-changer for any buyer, but it's especially critical if you're new to the process. For more on navigating this journey, check out these essential first-time home buyer tips.
It also helps to keep things in perspective. While you're zeroed in on a single zip code, understanding the bigger picture can be grounding. According to 2025 crime index rankings, some countries face systemic safety challenges that are worlds away from the localized property crime concerns in most U.S. neighborhoods.
Using Data as Negotiation Leverage
Your detailed research isn’t just for your own peace of mind; it's a powerful tool when you get to the negotiation table. If you can point to official police reports showing a recent uptick in burglaries on the very street you're considering, that's a valid point to bring up.
This isn't about scaring the seller; it's about making a fact-based case. You can use this information to justify a lower offer or to negotiate for specific concessions, like having the seller pay to install a new home security system.
When you present specific, documented local crime information, it shows you’ve done your homework and are a serious, informed buyer. This gives you a stronger position to secure better terms and ensures your final offer reflects the true reality of the neighborhood.
Once your confident home offer is accepted, the real fun of moving begins. If you're a first-time home buyer, you'll definitely appreciate these valuable tips for first-time movers. Ultimately, this whole process is about turning abstract data into a decision you can feel great about for years to come.
Got Questions About Crime Data? We've Got Answers.
Diving into neighborhood safety research can feel like opening a can of worms. You’ve got all this data at your fingertips, but what does it actually mean? It’s easy to feel a little lost.
Let's clear things up and tackle the most common questions people have when looking at local crime information. This is all about building confidence in your analysis, because understanding the quirks and limits of the data is just as crucial as finding it in the first place.
How Often Is Local Crime Data Updated?
This is a big one, and the answer is… it depends. The freshness of crime data varies a lot depending on where you're looking, which is exactly why you need to check a few different sources.
- Local Police Department Portals: These are usually your best bet for the most current information. Many departments update their public dashboards daily or weekly, giving you a near-real-time look at what's going on.
- Third-Party Mapping Sites: Tools like CrimeMapping.com often pull their data directly from local law enforcement. How often they sync up depends on their specific agreements, but it can be very recent.
- National Databases: Think big-picture sources, like the FBI's official data. This stuff is gold for spotting long-term trends, but it's typically only updated once a year. That means the information could easily be 12 months or more out of date.
Pro tip: Always hunt for a "last updated" date on any site you use. When you need the most immediate snapshot of a neighborhood, stick to the local sources.
Are Online Crime Maps Completely Reliable?
Online crime maps are a fantastic starting point, but they should never be the only tool in your box. They offer a great visual of where incidents are happening, but they often miss the critical context that can completely change how you see the data.
For instance, you might see a dense cluster of incidents around a major shopping center, a busy transit station, or a hospital. That’s pretty normal. These high-traffic commercial zones naturally have more activity and don’t necessarily say anything about the safety of the quiet residential streets just a few blocks over.
Think of a crime map as the first chapter of a story, not the entire book. It shows you what happened and where, but your on-the-ground research is what will tell you why and what it actually feels like for the people who live there.
The key is to use the maps alongside official reports and your own visits. That blend of digital digging and real-world observation is what gives you the most accurate feel for a neighborhood.
What Is Considered a High Crime Rate?
There's no magic number that automatically flags a neighborhood as having a "high" or "low" crime rate. What really matters is comparison and context. A single statistic floating in a void can be super misleading.
Your goal is to establish a clear baseline for your target area. The best way to do that is to compare a neighborhood’s stats against a few key benchmarks:
- The average for the wider city
- The average for the state
- The national average
If you see a rate for specific crimes—say, burglaries or auto thefts—that is way higher than these benchmarks, that's a red flag worth a closer look. It's also vital to see which way the trend is heading. A rate that's high but stable is a different story than one that's shooting up or, better yet, steadily dropping.
For landlords, keeping an eye on local trends is also a big part of protecting your investment and staying compliant. That's why staying on top of issues like landlord-tenant law in California is so important.
At Edinhart Realty and Property Management, we believe a smart real estate decision starts with having all the facts. Our team helps buyers, sellers, and investors navigate the complexities of the Fresno market by combining deep local knowledge with thorough, data-driven analysis. To learn how we can help you make a confident move, visit us at https://edinhart.com.


