

If you've ever used a fair market rent calculator, you're tapping into a powerful tool that uses data from the U.S. Department of Housing and Urban Development (HUD) to estimate typical rental rates in a specific area. By punching in your location and a few property details, you get a solid baseline—the Fair Market Rent (FMR)—that shows you where your property fits within the local market.
What Is Fair Market Rent and Why It Matters
Understanding Fair Market Rent is about more than just finding a number. It's about getting a feel for a key metric that truly shapes local rental markets. While its official job is to set payment standards for federal housing assistance programs, its impact reaches every single landlord and real estate investor out there.
Think of it as an essential economic indicator for the health of your specific rental market.
This data isn't just pulled out of thin air. HUD calculates FMRs annually for roughly 2,500 geographic areas across the country. It’s a meticulous process designed to ensure that rental assistance payments keep up with real-world market conditions, which is crucial for making housing accessible for lower-income families.
The Foundation of FMR Data
So, how does HUD land on these numbers? The whole process is built on a mountain of data from trusted sources. They draw heavily on information from the American Housing Survey and the U.S. Census Bureau, but they also supplement it with annual telephone surveys of local landlords. This multi-layered approach gives them a pretty accurate snapshot of rental costs in any given area.
At its core, Fair Market Rent is the metric used to set payment standards for programs like the Section 8 Housing Choice Voucher program. The FMR officially represents the 40th percentile of gross rents for standard-quality units in a specific housing market. This calculation deliberately excludes low-quality housing, subsidized units, and brand-new properties less than two years old.
The "gross rent" figure includes essential utilities like water and power but doesn't factor in extras like cable or internet.
One of the biggest mistakes I see people make is assuming FMR is the average rent. It’s not. It reflects the 40th percentile, which means 60% of the standard rental units in that market are actually priced higher. This makes FMR a conservative floor, not the ceiling for what you can charge.
Below is a glimpse of what you'll find on the HUD User portal, where all this data is publicly available.
This screenshot shows the official interface where you can dig into the FMR data yourself. You can easily filter by year, state, and county to get the specific rent details you need.
Before we dive into how to use this data, it helps to break down exactly what goes into the FMR calculation. These are the core components that shape the final number.
Core Components of Fair Market Rent
| Component | Description | Example |
|---|---|---|
| Geographic Area | The specific metropolitan or non-metropolitan county region for which the FMR is calculated. | The FMR for Chicago, IL will be vastly different from that of a rural county in the same state. |
| 40th Percentile Rent | The rent level below which 40% of standard-quality units are rented. It's a baseline, not an average. | If the 40th percentile rent for a 2-bedroom is $1,200, it means 40% of units rent for $1,200 or less. |
| Gross Rent | Includes the cost of the unit itself plus the estimated cost of essential utilities (e.g., water, electricity, gas). | A unit listed for $1,000/month with an estimated $150 in utilities has a gross rent of $1,150. |
| Standard-Quality Units | Units that are physically decent, safe, and sanitary, excluding those in severe disrepair or with major defects. | This ensures the data isn't skewed by substandard housing that rents for far below market rates. |
Understanding these pieces makes it clear that FMR isn't just an arbitrary figure—it's a carefully constructed benchmark based on real-world housing conditions.
Why Every Landlord Should Care
Even if you don't rent to tenants with housing vouchers, this FMR data is incredibly valuable. It gives you a solid, data-backed reference point for your own business. Here’s how you can put it to work:
- Gauge Market Health: Sudden jumps or drops in the FMR can be an early warning sign of shifts in local demand or supply.
- Set Competitive Prices: Knowing the baseline helps you avoid underpricing your property and leaving money on the table. It also keeps you from overpricing and dealing with a long, costly vacancy.
- Make Smarter Investments: When you're analyzing a potential investment property, FMR data helps you project realistic rental income from day one.
So, you understand what Fair Market Rent is, but how do you actually find the number for your specific market? This is where the rubber meets the road. Thankfully, the U.S. Department of Housing and Urban Development (HUD) provides a free, public-facing tool that does the heavy lifting for you.
Let's walk through how to use this fair market rent calculator—not just to pull a number, but to get real, actionable intel for your rental properties.
The process itself is refreshingly simple. You provide your location, run the tool, and get the data you need to make smarter pricing decisions.
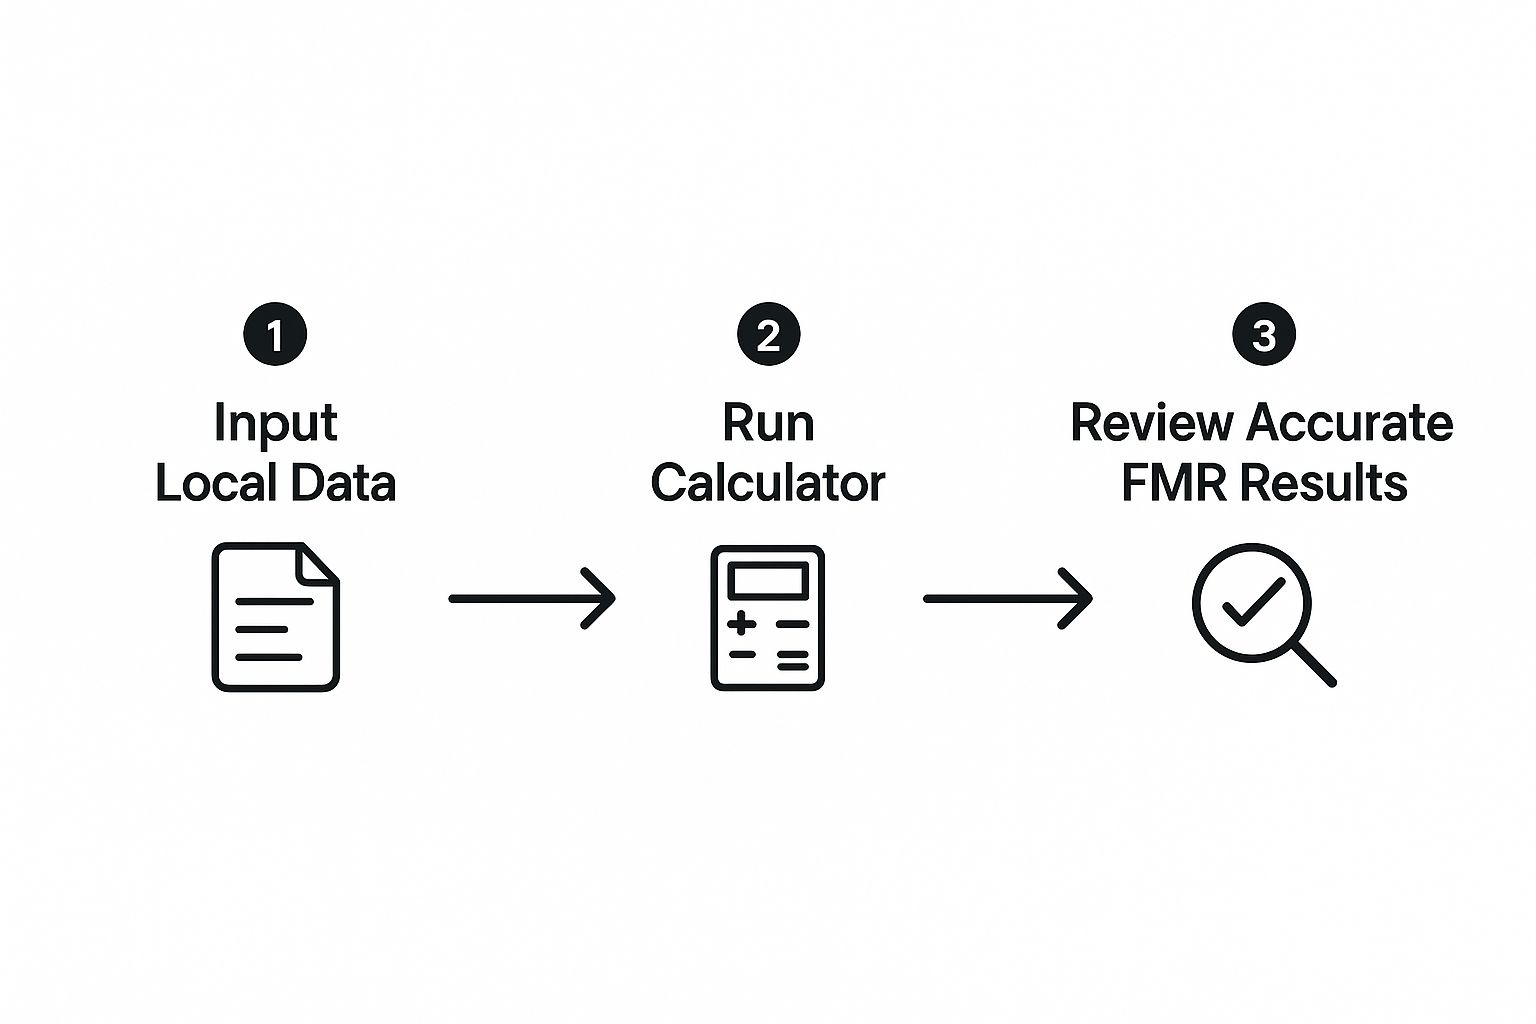
As the graphic shows, it’s all about turning a mountain of housing data into a single, usable figure for your business.
Pinpointing the Right FMR Data
Your first stop is the official HUD User portal, which houses all the FMR datasets. Once you land on the page, you'll need to select the fiscal year. My advice? Always stick with the most current year available. The only time you’d dig into the past is if you're intentionally researching historical rent trends.
From there, it’s a simple dropdown menu. Choose your state, then drill down to the specific county where your rental is located. This part is absolutely critical. FMRs don't just vary by state; they can shift dramatically from one county to the next.
Think about it: the FMR for a two-bedroom unit in a major metro area like Los Angeles County, California, will be worlds apart from a rural county just a couple of hours' drive away. Getting the location right from the get-go is the foundation for an accurate analysis.
What the Calculator's Results Really Tell You
After you’ve plugged in the location, the tool generates a clean table of FMR values. It breaks down the rent amounts by property size, usually starting from an efficiency or studio apartment (0 bedrooms) and going all the way up to a four-bedroom house.
When you look at the results, here’s what you need to zero in on:
- Bedroom Count: This is your primary filter. Scan the list and find the row that matches your property.
- FMR Value: This number represents the 40th percentile gross rent for that unit size in your county. Keep in mind that this figure already accounts for essential utilities.
- Other Percentiles: Sometimes, the tool will also display the 50th percentile (the median rent). This is another great data point to have for context.
The big takeaway here is that FMR is not a price ceiling. It's a baseline. It tells you what a standard, no-frills unit rents for in your market. Your property—with its recent upgrades, better location, or superior amenities—is almost certainly worth more.
Don't Just Look at Today's Number
The real power of the HUD calculator comes from looking beyond the current year. The tool lets you easily pull up data from previous fiscal years, giving you a clear view of how rents have trended over time. I often look back three to five years to spot patterns. Is the market growing, or has it been flat?
This historical context is invaluable for forecasting. For instance, if you notice a consistent 5% annual increase in FMR, you can build that assumption into your financial planning and justify future rent adjustments to your tenants.
Understanding these trends is also crucial when you're sizing up a new investment. To see how these rent figures really affect your bottom line, plugging them into a comprehensive rental property ROI calculator can give you a much clearer picture of your potential returns.
When you get comfortable with this tool, you stop seeing it as just a government database. It becomes a strategic asset you can use to set competitive rents, validate a deal, and stay ahead of the curve in your local market.
The Forces That Really Shape Fair Market Rent
Ever looked at the Fair Market Rent for your area and wondered how it jumped 10% in a single year? Those numbers you see in an FMR calculator aren't pulled out of thin air. They're a direct reflection of powerful economic and local forces constantly shifting behind the scenes. Getting a handle on these drivers is what separates a reactive landlord from a truly proactive investor.
At a high level, HUD's annual updates are tied to broad economic trends. Things like national inflation rates and big shifts in interest rates create ripples that eventually wash over every local rental market. It’s simple, really—when the cost of living goes up, so does the pressure on rent.

You can see this playing out across the country right now. The U.S. rental market is showing clear regional differences in growth. While national rent increases have slowed to around 3.1% because of new supply and inflation, some areas are hotter than others. The Southwest, for instance, is projected to see the highest growth at 3.4%, while the Western U.S. is expected to climb more modestly at 2.2%. These variations, often influenced by Federal Reserve policies, directly impact how HUD sets local FMRs. It's a constant balancing act between market realities and affordability. You can find more insights on how 2025 rental market trends are shaping prices across different regions.
It's All Local
While national trends set the stage, it's the local factors that often steal the show. The biggest player here is the timeless law of supply and demand. If there's a shortage of available housing—a story all too common in many cities—rents will almost always go up.
Think about these real-world scenarios that can completely change the game for your local FMR:
- A Major Employer Moves In: A big tech company announces a new campus, bringing thousands of well-paid professionals to town. Suddenly, the demand for quality rentals skyrockets.
- Population In-Migration: The cost of living in a neighboring state gets too high, pushing a wave of new residents into your more affordable area. Competition for every available unit intensifies.
- Restrictive Zoning: City hall has strict zoning laws that make it difficult to build new apartment complexes. This chokes the housing supply, causing prices for existing rentals to climb year after year.
Even something like the quality of the local school district can have a massive impact. I've seen it time and again—desirable school districts create their own little micro-markets where rental demand is consistently through the roof. We actually have a whole guide on the direct link between schools and real estate values if you want to dig deeper.
A little tip from my own experience: start keeping an eye on local news. Pay attention to city council meetings discussing new developments or press releases from major employers. This gives you a chance to anticipate FMR changes before they're officially announced, letting you adjust your rental strategy to stay ahead of the curve.
At the end of the day, Fair Market Rent is a snapshot of all these forces combined. It’s a single number that tells a rich story about job growth, housing availability, and the economic pulse of your community. Learning to read those signals is what turns a good investor into a great one.
Looking Beyond the FMR to Find Your Property's True Value
Getting the fair market rent (FMR) number is a great first step, but stopping there is a classic rookie mistake. I've seen countless landlords leave money on the table by treating that figure as the final price.
You have to remember what the FMR actually represents: the 40th percentile. That means a full 60% of standard rental properties in your market are priced higher. Your real job is to uncover your property's true market value, which often sits comfortably above that FMR baseline.
This is where a little detective work comes in, in the form of a comparative market analysis (CMA). It’s all about finding properties that are genuinely similar to yours. Don’t just compare your three-bedroom house to any other three-bedroom house. You need to zero in on rentals in your specific neighborhood—maybe even your school district—that are a similar age and size.
Getting Your Hands on the Right Comps
A solid CMA hinges on finding good "comps" (comparable properties). You’ll want to dive into online listing sites like Zillow and Apartments.com. But don't just take the first few listings you see at face value. Be critical.
I always tell people to focus on listings that are either active right now or were just rented within the last 30 to 60 days. In a market that changes quickly, anything older than that is basically stale data.
Drill down into the details that really matter:
- Location: A property just a few blocks over can be in a totally different submarket with different rent expectations.
- Size and Layout: If you have a two-bed, one-bath unit, that’s your comparison point. Don’t muddy the waters by looking at two-bed, two-bath layouts.
- Condition: Be brutally honest with yourself. Is your property freshly renovated with modern finishes, or is it showing its age? Compare it to units of a similar condition.
A common trap is spotting the most beautifully staged, high-end rental in the area and trying to match its price. A much better strategy is to find three to five solid comps: one that’s a bit nicer than yours, one that's a bit worse, and a couple that are nearly identical. This triangulation gives you a realistic price range to operate in.
Factoring in Your Property's Unique Features
Once you have a baseline price from your comps, it's time to fine-tune it based on what makes your property special. Not all amenities are created equal, and understanding what tenants in your area will actually pay a premium for is key.
For example, a freshly renovated kitchen with stainless steel appliances can often justify an extra $100 to $200 a month. Other features that consistently command higher rent include:
- Dedicated off-street or garage parking
- An in-unit washer and dryer (this is a huge one)
- A private balcony or a properly fenced yard
- Central air conditioning, especially in warmer climates
Don't just pull a number out of thin air for these upgrades. Go back to your comps. How much more is a unit with a garage renting for compared to one without? This data-driven approach takes the guesswork out of it. If you want to dig even deeper, our guide on how to price a rental property walks through this adjustment process in more detail.
Below is a quick look at how different sources might value the same hypothetical property, showing why it's crucial to look at more than one number.
Comparing Rent Data Sources for Your Property
| Data Source | Estimated Monthly Rent | Key Considerations |
|---|---|---|
| HUD Fair Market Rent | $1,450 | Represents the 40th percentile; a baseline, not a target. |
| Zillow Rent Zestimate® | $1,625 | Algorithm-based; accuracy can vary by market. Good for a quick check. |
| Rentometer | $1,590 | Provides a range based on recent listings. Useful for seeing the spread. |
| Local CMA (Your Research) | $1,650 | Most accurate, as it accounts for specific conditions and amenities. |
As you can see, relying solely on the FMR would mean underpricing the unit by as much as $200 per month.
Ultimately, setting your final rent is a balancing act. You want a price that maximizes your return on investment without scaring away good tenants and creating a costly vacancy. I’ve learned that a slightly lower rent that attracts a fantastic, long-term tenant is almost always more profitable than squeezing out every last dollar and risking an empty unit for a month or two.
Common Rental Pricing Mistakes to Avoid

Setting the right rent is a delicate balance, and I've seen even seasoned landlords get it wrong. Using a fair market rent calculator is a fantastic starting point, but it's just that—a start. Relying on that single number without understanding the context is a surefire way to make some costly errors.
Let's walk through some of the most common pitfalls I see landlords fall into, and more importantly, how you can sidestep them.
The single biggest mistake? Treating the Fair Market Rent (FMR) as your final asking price. You have to remember what that number actually represents: it's the 40th percentile. This means a full 60% of properties in your market are renting for more. If you aim for the FMR, you're almost certainly underpricing your unit and leaving money on the table every single month.
Another frequent oversight is forgetting that the FMR figure typically includes essential utilities. If you list your property at the FMR price but then ask tenants to cover water and electricity, your effective rent is suddenly much higher than the benchmark. This can make your unit look overpriced and uncompetitive, leading to the one thing we all want to avoid: a long, painful vacancy.
Ignoring Your Property's Unique Value
Every rental has something that makes it stand out. A landlord who overlooks these unique selling points is making a huge pricing error. Your job is to put a real dollar value on those amenities and adjust your rent accordingly.
Think about the common value-adds that tenants are more than willing to pay a premium for:
- A recent renovation: A sparkling new kitchen or a modern, updated bathroom can easily justify a higher monthly rent compared to a unit with dated, tired finishes.
- A prime location: Is your property a short walk from a popular park, a great school, or the light rail station? That convenience has tangible, marketable value.
- Desirable features: In-unit laundry, a dedicated parking spot, or a private balcony are the kinds of perks that set your property apart and command a higher price.
Failing to account for these features means you’re pricing your superior unit the same as a basic, no-frills apartment down the street. That's just bad business.
I once worked with an owner who priced their newly remodeled condo based solely on the FMR. After a quick market analysis, we adjusted the price up by $250 per month to reflect the high-end finishes and prime location. It rented in under a week, adding an extra $3,000 in revenue over the year.
Neglecting Market Dynamics and Updates
The rental market is anything but static; it's constantly shifting. A "set it and forget it" approach to pricing is a recipe for lost income. You have to stay tuned to market shifts and any regulatory updates that can impact rental values.
A perfect example of this is HUD’s annual recalibration of rent and income limits. These updates, which feed into tools like the fair market rent calculator, shape payment standards across the country based on the latest economic data and rental growth projections.
While national averages might show a modest increase, local markets—especially those with high demand—can see some pretty dramatic changes. Staying on top of these adjustments is crucial for any property manager. You can learn more about how HUD’s annual updates affect rent limits to get a better handle on these trends.
Your Top FMR Questions, Answered
Once you start digging into fair market rent calculators, a few key questions almost always pop up. It's one thing to get the numbers, but it's another to know exactly what they mean for your property. Let's clear up some of the most common points of confusion landlords run into.
Think of this as the practical advice you'd get from a seasoned property manager. We'll cover how often the numbers change, whether you should actually charge this amount, and the often-misunderstood role of utilities.
How Often Is Fair Market Rent Updated?
This is a big one. You're right to wonder how fresh this data is. The U.S. Department of Housing and Urban Development (HUD) updates FMR figures annually. The new rates usually come out in the fall and officially go into effect on October 1st, aligning with the start of the federal government's fiscal year.
For you, this means an annual check-in is a smart move. Around late September, it's a good habit to look up the latest numbers to ensure your pricing strategy is based on the most current data.
Is FMR the Same as My Market Rent?
Absolutely not. This is probably the most critical distinction to understand. FMR is not a sticker price for your unit. In fact, it's almost never the rent you should be charging on the open market.
FMR is set at the 40th percentile of gross rents for an area. In plain English, that means 60% of standard rental units in that market are actually priced higher than the FMR.
FMR is a floor, not a ceiling. It’s just one piece of the puzzle. The true market rent for your property is likely higher, especially if you offer great amenities, a prime location, or a newly renovated space.
To figure out what you should really be charging, you need to do your homework with a comparative market analysis (CMA). That means digging into what similar, nearby properties (your "comps") are renting for right now and adjusting based on what makes your unit stand out.
Are Utilities Included in Fair Market Rent?
Yes, they are, and this detail trips up a lot of landlords. FMR is what’s known as a "gross rent." That figure bundles the base rent for the unit plus an estimated allowance for essential, tenant-paid utilities.
So, what's considered "essential"?
- Electricity
- Natural Gas
- Water and Sewer
- Trash Collection
Things like cable TV, internet, or a landline phone are not included in that calculation. When you're comparing your property's rent to the FMR, make sure you're comparing apples to apples. You have to account for which utilities you cover versus what the tenant pays out of their own pocket.
Can I Find FMR for a Specific Neighborhood?
In most cases, FMR is published for an entire county or metropolitan area, which can be frustratingly broad. However, HUD recognized this limitation. In areas where rental prices can swing wildly from one neighborhood to the next, they provide a much more focused tool: Small Area Fair Market Rents (SAFMRs).
These SAFMRs break the data down to the ZIP code level. This gives you a far more accurate picture of rental values right where your property is located. If SAFMRs are available in your market, they are a much better benchmark to use. It's always worth checking to see if this hyper-local data exists for your area.
Setting the right rent is part science, part art. If you want to skip the guesswork and ensure you're maximizing your investment, the team at Edinhart Realty and Property Management can help. We provide expert analysis grounded in real-time local market data. Discover more about our professional property management services.


