

Before you can confidently calculate a rental property's value, you need to understand a fundamental truth: there's no single magic number. Instead, seasoned investors look at a property through three different lenses. This approach gives you a well-rounded picture, combining hard numbers from cash flow with what's actually happening in the market.
Why Getting The Valuation Right Is Everything

An accurate valuation is the single most powerful tool in your real estate investing arsenal. Every decision you make—from the price you offer to the rent you charge—is built on that foundation. Getting this number wrong is a surefire way to overpay for a property or, just as bad, completely miss its long-term potential.
Think of it like buying a car. You wouldn't just look at the paint job and make an offer. You’d check the engine, pull the history report, and see what similar cars are selling for. A rental property is a much bigger investment, and it demands even more rigorous due diligence. A solid valuation keeps you from making emotional mistakes and anchors your entire strategy in hard data.
This isn't a small-stakes game. The global real estate rental market was recently valued at an eye-watering USD 2.91 trillion, with projections showing it could climb to USD 3.87 trillion by 2029. That explosive growth, driven by big economic shifts and changing lifestyle preferences, presents a massive opportunity for investors who know how to spot a genuinely valuable property.
To give you a clearer picture of how pros approach this, here’s a quick summary of the methods we're about to break down.
Three Core Methods for Valuing Rental Property
| Valuation Method | What It Measures | Best For |
|---|---|---|
| Income Approach (Cap Rate & NOI) | The property's profitability and cash flow. | Analyzing the investment purely on its financial performance. |
| Sales Comparison Approach (Comps) | The property's market value based on similar sales. | Grounding your offer in real-world market conditions. |
| Gross Rent Multiplier (GRM) | A quick ratio of price to annual gross rent. | Quickly screening multiple properties to see if they're overpriced. |
Each of these methods offers a unique perspective, and a smart investor uses all three to build a complete and defensible valuation.
The Three Lenses of Property Valuation
To confidently analyze any deal, you need a clear roadmap. Think of these three methods as different lenses, each revealing a unique and critical aspect of the investment.
- The Income Approach: This is all about the money. It zeroes in on the property’s ability to generate cold, hard cash flow. This is the financial deep dive that tells you if the property can pay for itself and still put profit in your pocket.
- The Sales Comparison Approach: This method keeps you grounded in reality. By looking at what similar, nearby properties have recently sold for, you can figure out what the market is truly willing to pay right now.
- The Gross Rent Multiplier (GRM): Think of this as your rapid-fire screening tool. It’s a quick-and-dirty calculation that helps you instantly spot properties that are wildly overpriced relative to their rental income, letting you weed out the duds fast.
Key Takeaway: Relying on just one of these methods is a recipe for disaster. The real skill is in synthesizing the data from all three to arrive at a valuation you can stand behind. It’s your best defense against overpaying and your clearest path to understanding a property’s true potential.
Part of the art of investing is learning which method to lean on in different situations. For example, in a market with steady rents but not many recent sales, the Income Approach becomes your most reliable guide. But in a hot, fast-moving market with tons of sales activity, the Sales Comparison Approach is absolutely essential.
If you want a head start, you can plug some numbers into our https://edinhart.com/rental-property-value-estimator/ for a quick analysis. This guide will walk you through the exact principles that make that tool work.
The Income Approach: Uncovering a Property's True Worth with NOI and Cap Rate
If you want to value a rental property like a pro, you need to think like an investor. That means looking past the fresh paint and focusing on what really matters: its ability to generate income. This is what we call the income approach, and it's the most reliable method for determining if a property is a solid investment or a financial headache waiting to happen.
The entire approach boils down to two key figures: Net Operating Income (NOI) and the Capitalization Rate (Cap Rate). Get these two right, and you’ll have a clear, data-backed valuation. Let's dig into how they work together.
First, Calculate the Net Operating Income (NOI)
Think of Net Operating Income as the annual profit a property generates before you account for your mortgage or income taxes. It’s a pure measure of the asset's performance.
Why leave out the mortgage? Because your financing is unique to you. By removing it from the equation, you can compare two different properties on a true apples-to-apples basis, regardless of whether one was bought with cash and the other with a loan.
Your starting point is Gross Scheduled Income (GSI)—the absolute maximum rent you could collect if the property was occupied 100% of the time. For a duplex where each unit rents for $1,800 a month, your GSI is $43,200 for the year ($1,800 x 2 units x 12 months).
Of course, 100% occupancy is a fantasy. You have to account for vacancies. A conservative 5-8% vacancy loss is a realistic buffer. Subtracting this from your GSI gives you the Effective Gross Income (EGI), a much more realistic picture of your potential income.
Don't Miss the Hidden Expenses That Sink New Investors
This is the step where so many beginners get into trouble. They look at the monthly rent, subtract the mortgage payment, and assume the rest is pure profit. That's a catastrophic miscalculation. Real-world operating expenses are numerous and can quickly eat away at your returns.
To find your true NOI, you have to meticulously track every single cost. Here's a quick checklist of expenses you can't afford to ignore:
- Property Taxes: Your annual bill from the city or county.
- Property Insurance: The cost of your landlord or hazard policy.
- Utilities: Any services you cover as the owner, like water, sewer, or trash.
- Repairs & Maintenance: Budget at least 5-10% of gross rent. This covers the inevitable leaky faucets, running toilets, and appliance fixes.
- Property Management Fees: If you hire a manager, expect to pay 8-10% of the collected rent.
- Capital Expenditures (CapEx): This is the big one. You must set money aside for major replacements down the road—think roofs, HVAC systems, and water heaters. A good rule of thumb is another 5-10% of gross rent.
Investor Insight: Forgetting to budget for Capital Expenditures is one of the fastest ways to turn a "cash-flowing" property into a liability. A new $10,000 roof can wipe out years of profit in an instant if you haven't been saving for it.
On the bright side, many of these expenses can reduce your tax burden. For a deeper dive, check out our guide on rental property tax deductions.
This visual helps tie it all together, showing how you get from gross income to a final valuation.
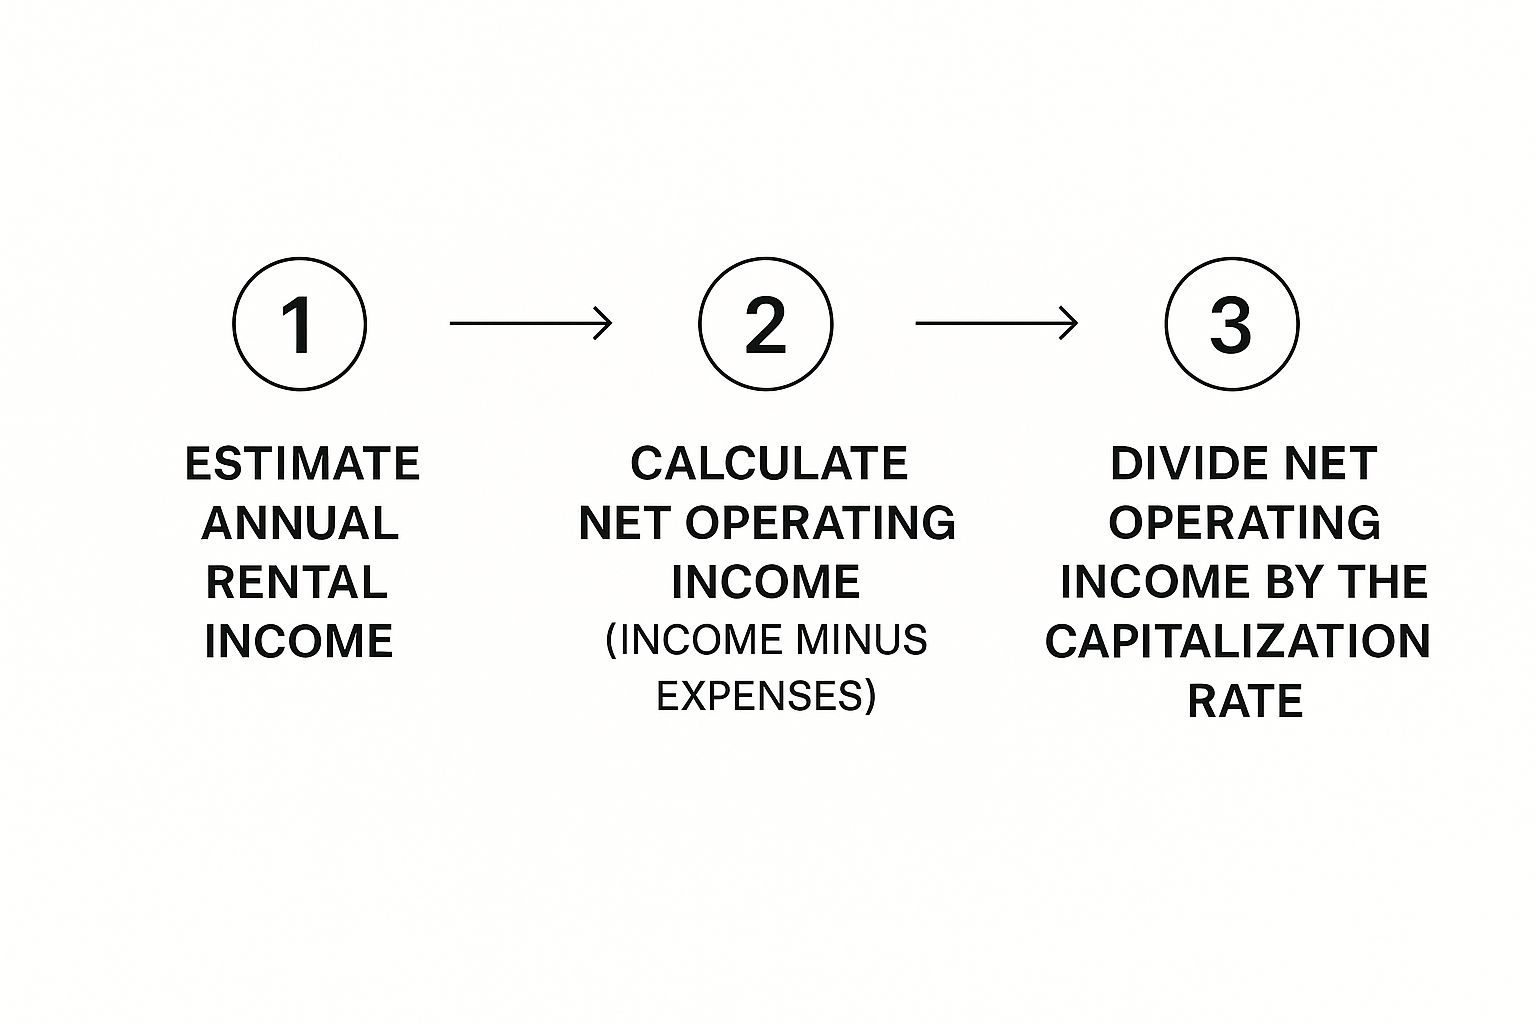
As you can see, a property's value is a direct function of its income-generating power, viewed through the lens of the current market cap rate.
Next, Unravel the Mystery of the Cap Rate
With your NOI calculated, you need the other half of the equation: the Capitalization Rate, or Cap Rate. The cap rate is a percentage that shows the potential rate of return on an investment property. It’s essentially a snapshot of the market's current mood, reflecting risk and opportunity.
The formula is straightforward: Cap Rate = NOI / Property Value.
But since our goal is to find the property's value, we just flip that formula around:
Property Value = NOI / Cap Rate
So, what does the cap rate tell you? A lower cap rate (say, 4-5%) usually means lower risk and higher demand. You'll see these in prime, stable neighborhoods with great tenants (Class A properties). A higher cap rate (maybe 8%+) suggests higher risk but also the potential for a better return, which is common for properties in up-and-coming areas or those that need some work (Class C properties).
You can't just pull a cap rate out of thin air. You find it by researching what similar, nearby properties have sold for recently. A good local real estate agent or property manager who is active in the investment space is your best resource for this crucial piece of data.
Putting It All Together: A Real-World Valuation
Let's run the numbers on our duplex example.
- Gross Scheduled Income: $43,200 per year
- Less Vacancy (5%): –$2,160
- Effective Gross Income (EGI): $41,040
Now for the operating expenses.
| Expense Category | Annual Cost |
|---|---|
| Property Taxes | $4,500 |
| Property Insurance | $1,500 |
| Repairs & Maintenance (5% of GSI) | $2,160 |
| Capital Expenditures (5% of GSI) | $2,160 |
| Property Management (8% of EGI) | $3,283 |
| Total Operating Expenses | $13,603 |
Subtracting the expenses from the EGI gives us our NOI:
$41,040 (EGI) – $13,603 (Expenses) = $27,437 (NOI)
Let's say your research shows that similar duplexes in this specific neighborhood are selling at a 6% cap rate. Now you have everything you need.
Property Value = $27,437 (NOI) / 0.06 (Cap Rate) = $457,283
Just like that, you have a powerful, data-driven valuation. This isn't a guess; it's what the property is worth based on its proven financial performance in the current market. This is the number you can confidently take to the negotiating table.
Using Market Comps for a Reality Check

While all those income calculations tell you what a property should be worth based on its cash flow, the market always has the final say. At the end of the day, a property is only worth what someone is willing to pay for it.
This is where the Sales Comparison Approach comes into play. It's a crucial reality check that grounds your spreadsheets in the real world. This is the same method professional appraisers use, and it’s all about finding recently sold properties that are as similar as possible to the one you’re looking at. These are your "comparables," or "comps," and finding the right ones is more of an art than a science.
How to Find Truly Comparable Properties
The goal here is simple: find properties that a potential buyer for your target property would also have seriously considered. It goes way beyond just matching the bedroom and bathroom count. A truly good comp mirrors your target property on multiple fronts.
When you're pulling comps, you need to think like an appraiser. Focus on these critical attributes:
- Location: This one is non-negotiable. Your comps should be in the same neighborhood—ideally within a half-mile radius—and fall within the same school district and local amenity zones.
- Property Type: You have to compare apples to apples. A single-family home only gets compared to other single-family homes. A duplex needs to be sized up against other duplexes. Simple as that.
- Age and Condition: A charming 1950s bungalow with its original plumbing is in a different league than a 2020 new build, even if they're next-door neighbors.
- Square Footage: Try to find comps that are within 10-15% of your target property’s size.
- Lot Size: Especially in suburban areas, the size of the yard and how it can be used can swing the value quite a bit.
- Recent Upgrades: A home with a sparkling new kitchen and a brand-new roof is naturally going to sell for more than one with a 20-year-old roof and dated appliances.
Investor Tip: From my experience, the best comps are those sold within the last three months. In a fast-moving market, six-month-old sales data can already be stale. Always prioritize the freshest sales to get an accurate pulse of the market.
The Art of Making Adjustments
It's almost impossible to find two properties that are absolutely identical. That's why you'll need to make financial adjustments to the sales prices of your comps to account for any differences. This part of the process is definitely subjective, but it's essential for arriving at a number you can trust.
Here's how it works. If a comp is superior to your property (for instance, it has a finished basement and yours doesn't), you subtract the value of that feature from the comp’s sale price. Conversely, if the comp is inferior (say, it has an older roof), you add the value to its sale price.
This whole exercise helps you answer one key question: "What would this comparable property have sold for if it had the exact same features as my target property?"
It's also critical to understand what's happening in the local rental market, as this directly influences what buyers will pay. For example, while the national median rent in the U.S. might be around $1,373, that number hides massive differences. Big city markets like New York can see median rents soar to $4,300, while in a state like Arkansas, they might be closer to $1,093. Knowing where your area stands is key. You can explore more detailed rental market trends on resimpli.com to get a better feel for the local context.
A Practical Valuation Scenario
Let's walk through a real-world example. Imagine you're analyzing a 3-bed, 2-bath, 1,500 sq ft home. After some digging, you find three recent sales in the same neighborhood.
| Property | Sale Price | Key Differences from Your Target | Adjustment | Adjusted Price |
|---|---|---|---|---|
| Comp 1 | $410,000 | Has a renovated kitchen (value: $15,000) | -$15,000 | $395,000 |
| Comp 2 | $385,000 | Needs a new roof (cost: $10,000) | +$10,000 | $395,000 |
| Comp 3 | $405,000 | Slightly smaller (1,400 sq ft) | +$5,000 | $410,000 |
By making these adjustments, you start to see a clear picture. Both Comp 1 and Comp 2 point directly to a $395,000 value. Comp 3 is a little higher, but now you have a confident, triangulated market value likely between $395,000 and $405,000. This is the reality-based number you can use to build your offer, ensuring it’s competitive without being based on wishful thinking.
The Gross Rent Multiplier for Quick Screening
In a hot market, you don't have the luxury of running a full financial workup on every property that pops up on Zillow. Let's be real—you need a way to quickly weed out the duds and zero in on the deals that are actually worth your time.
This is where the Gross Rent Multiplier (GRM) becomes one of my favorite back-of-the-napkin tools. Think of it as your first-pass filter. It’s a simple calculation that gives you a gut check on whether a property's price is even in the right ballpark for its income potential. With it, you can instantly flag overpriced listings and focus your energy—and your detailed analysis—on the properties that have a real shot.
Calculating the Gross Rent Multiplier
The formula couldn't be simpler. You just take the property's price and divide it by its total annual rent before any expenses are taken out.
Gross Rent Multiplier (GRM) = Property Price / Gross Annual Rent
So, if a duplex is listed for $400,000 and brings in a total of $40,000 a year in rent, your GRM is 10. Easy enough. But that number means absolutely nothing on its own. The real magic happens when you start comparing it.
Key Takeaway: A property’s GRM is only valuable when compared to the going rate for similar properties in the same neighborhood. A "good" GRM in Dallas could be a terrible one in Denver. It's all about local context.
To figure out the market GRM, you need to do a little homework on recent sales. Look up what comparable properties sold for and what their gross rents were at the time. If you see three similar duplexes in the area recently sold with GRMs of 8.5, 8.8, and 9.0, you now have a solid benchmark. The local market GRM is likely around 8.7.
The Critical Limitations of GRM
I have to be very clear about this: while GRM is great for quick sorting, it has a massive blind spot. It completely ignores a property's expenses. This is the single most important thing to remember about this metric.
Because it only looks at top-line rent, the GRM tells you zip about actual profitability. You could have two properties with the exact same GRM, but one is a cash cow and the other is a money pit. One might have a brand-new roof and low taxes, while the other is staring down a huge special assessment and has ancient, inefficient HVAC systems.
For this reason, GRM should never be your final word on valuation. It’s a starting point, not the finish line. Always, always follow up with a detailed NOI and Cap Rate analysis for any property that makes it past your initial GRM screen.
To make this distinction crystal clear, here’s a quick comparison of how Cap Rate and GRM approach valuation from different angles.
Valuation Method Comparison: Cap Rate vs. GRM
This table breaks down the fundamental differences between these two common metrics. One is focused on profit, the other on a property's price relative to its revenue.
| Metric | Calculation Focus | Pros | Cons |
|---|---|---|---|
| Cap Rate | Net Operating Income (Profit) | Gives a true picture of profitability by factoring in operating expenses. A much better indicator of investment performance. | Requires more data (expenses) that might not be readily available, making it harder to calculate on the fly. |
| GRM | Gross Annual Rent (Revenue) | Incredibly simple and fast to calculate with just two numbers (price and rent). Excellent for initial screening of many properties. | Completely ignores expenses, so it doesn't reflect actual cash flow or profitability. Can be very misleading if used in isolation. |
Understanding both is key. You use GRM to find the potential deals, then you use Cap Rate to confirm if they're actually good deals.
Using GRM to Compare Listings
Let's walk through a real-world scenario. You're looking at three similar duplexes for sale in the same part of town. From your research, you know the average GRM for this area is 9.
- Duplex A: Listed at $450,000 with $50,000 in gross annual rent.
- GRM = $450,000 / $50,000 = 9.0
- Duplex B: Listed at $520,000 with $50,000 in gross annual rent.
- GRM = $520,000 / $50,000 = 10.4
- Duplex C: Listed at $425,000 with $50,000 in gross annual rent.
- GRM = $425,000 / $50,000 = 8.5
With a quick glance, you can draw some powerful conclusions. Duplex A is priced right at the market average—no bargain, but not overpriced. Duplex B, with a GRM of 10.4, seems way too expensive for the rent it generates. You can probably move on from that one without wasting another minute.
But Duplex C is the one that should make your investor senses tingle. Its GRM of 8.5 is noticeably below the market average. This signals that it might be underpriced for its income. This is the property that earns your immediate attention for a full-blown analysis to calculate its true rental property value.
Putting It All Together for a Final Valuation
So, you've done the heavy lifting. You've run the numbers using the Income Approach, the Sales Comparison Approach, and the Gross Rent Multiplier. Now you're probably looking at three different valuations and asking yourself, "Which one is right?"
Here’s the thing: they all are, in their own way. But none of them, standing alone, gives you the complete picture. The final step isn't about picking a winner. It's about blending these figures into a single, defensible valuation. This is where you move beyond the calculator and start thinking like a seasoned investor.
Weighing the Valuation Methods
Think of your three valuations as different expert opinions. Your job is to decide how much weight to give each one based on the specific property and, just as importantly, the current market dynamics. There's no magic formula here; it’s all about context.
For example, in a stable rental market with predictable income and low vacancies, I lean heavily on the Income Approach (your cap rate valuation). When cash flow is king and appreciation is a slow, steady burn, this metric tells you the most important part of the story.
On the other hand, in a hot market where prices are jumping month over month, the Sales Comparison Approach takes center stage. In that kind of environment, what buyers are willing to pay right now can often overshadow a property's current cash flow performance.
Investor Insight: The GRM is really your first-pass filter, not a primary valuation tool. I use it to quickly screen out duds. By this stage, its most important job is already done—it helped you decide if a property was even worth a deeper look.
A Practical Blended Valuation Example
Let's walk through a real-world scenario. Say your analysis spits out these three numbers for a duplex you're eyeing:
- Income Approach Value: $457,000
- Sales Comparison Value: $475,000
- GRM-Based Value: $440,000
You've done your homework and know the local market is appreciating nicely, but it also has strong, consistent rental demand. So, you decide the comps deserve the most weight, the income approach is a close second, and the GRM is a minor supporting factor.
Your thought process could look something like this:
- Sales Comps (50% weight): $475,000 x 0.50 = $237,500
- Income Approach (40% weight): $457,000 x 0.40 = $182,800
- GRM (10% weight): $440,000 x 0.10 = $44,000
Add them up, and you get your final blended valuation: $237,500 + $182,800 + $44,000 = $464,300.
Now you have a data-backed target price to guide your offer, not just a gut feeling.
Factoring in the Intangibles
The numbers tell a big part of the story, but they don't tell all of it. A truly smart valuation layers in the qualitative factors—the things a spreadsheet will never capture. This is where your on-the-ground knowledge becomes an incredible asset.
You have to look beyond the data and ask critical questions:
- Zoning Changes: Is the city planning to rezone the neighborhood for higher density? That could dramatically increase future value.
- Employer Movements: Is a major company opening a new headquarters nearby, or is one about to leave town? This will directly impact tenant demand.
- Hidden Problems: Does the property have a 20-year-old roof or a rusty HVAC unit that the comps don’t reflect? These are huge future costs.
Broader economic trends also play a massive role. For instance, the ongoing global housing shortage is a powerful tailwind for rental property owners. With a deficit of millions of housing units, the affordability crisis forces more people to rent, creating a durable base of demand. Hines published some great insights on this global trend.
For investors who want to get ahead of the curve, mastering real estate data analytics is the next frontier. It helps you spot trends before they become obvious. And of course, local expertise is irreplaceable. If you’re investing in Central California, for example, understanding the specific market pressures is crucial. Our deep dive into the Fresno property management landscape offers that kind of essential local context.
When you combine hard numbers with these qualitative insights, you build an investment thesis that is both robust and realistic.
Common Questions on Rental Property Valuation
Once you have the formulas down, the real world has a way of throwing curveballs. Running the numbers is one thing, but applying them to an actual property brings up a ton of practical questions. After years in this business, I've seen investors grapple with the same nuances time and again.
Getting these details right can be the difference between a profitable asset and a financial drain, especially in fast-moving markets like California, where real estate costs have climbed at a historic pace. Let's tackle some of the most frequent questions that come up.
How Much Should I Budget for Maintenance and Repairs?
This is a big one. Underestimate this, and your cash flow is toast. You've probably heard of the 1% Rule, which suggests setting aside 1% of the property's purchase price each year for maintenance. It's a decent, quick-and-dirty estimate, but it's far from perfect.
I've found a much more reliable method is to budget between 5% and 10% of the gross rental income. This approach makes more sense because it scales your maintenance budget with the property's actual revenue.
For older homes or properties in areas with tough weather conditions, I always push my clients to err on the side of caution. Bumping that budget up to 15% is a smart move. And nothing—absolutely nothing—replaces a thorough professional inspection. It's the best way to spot big-ticket items like an aging roof or a furnace on its last legs before they become emergencies.
What Is a Good Cap Rate for a Rental Property?
Ah, the million-dollar question. The honest answer? There is no single "good" cap rate. It all comes down to the market, the property type, and your tolerance for risk.
Think of it this way:
- Low Cap Rates (4-6%): You'll see these in stable, high-demand urban centers (think Class A properties). The risk is low, but your immediate return is modest.
- High Cap Rates (8-12%+): These are more common in up-and-coming or lower-income neighborhoods (Class C properties). That higher number is your reward for taking on more risk, like higher potential vacancy or more frequent tenant issues.
Context is everything. The goal isn't to chase a specific number. Instead, you should compare your target property's cap rate to the average cap rate for similar properties in that exact neighborhood. That’s how you know if you're looking at a fair price, a great deal, or an overpriced property.
Can I Use Online Valuation Tools?
Online estimators, like the Zestimate you see on Zillow, can be handy for a quick, ballpark figure. They give you a snapshot of the market based on a simplified version of the Sales Comparison Approach.
But here’s the critical part: you should never rely on them for your final valuation. These automated tools have massive blind spots.
They often can't see the full picture:
- The sales data they use can be outdated.
- They have no idea what condition the property is in or if it has recent upgrades.
- They don't know the property's true rental income or its actual operating expenses.
An algorithm can't tell if the kitchen was just gutted and remodeled or if there's a crack in the foundation. That's why you have to do your own homework. It’s the only way to confidently calculate rental property value and protect your investment. The effort you put into a deep-dive analysis is what separates the pros from the speculators.
Navigating the complexities of property valuation and management requires local expertise. At Edinhart Realty and Property Management, we combine data-driven analysis with on-the-ground knowledge of the Central California market to help our clients make informed decisions and maximize their returns. Whether you're buying, selling, or looking for expert management, find out how we can help you achieve your real estate goals at https://edinhart.com.


